

Last updated on July 20, 2026 at 12:53 AM
Search accounts for 45.73% of FlexiSpot’s estimated visits in the supplied six-month view. Yet the questions that decide a desk purchase—wobble, fit, assembly, tabletop quality, delivery, warranty, and support—sit beyond the click.
The useful question is not which channel “won,” but where confidence breaks between discovery and choice. Search and paid social create exposure for FlexiSpot; official comparison, specification, policy, and setup pages must carry the decision; reviews, community reports, and AI answers reveal whether the evidence stays consistent.
This case study connects estimated website traffic, search behavior, community discussion, and AI-citation data. The figures are dated third-party snapshots—not FlexiSpot sales, customer, conversion, or market-share data.
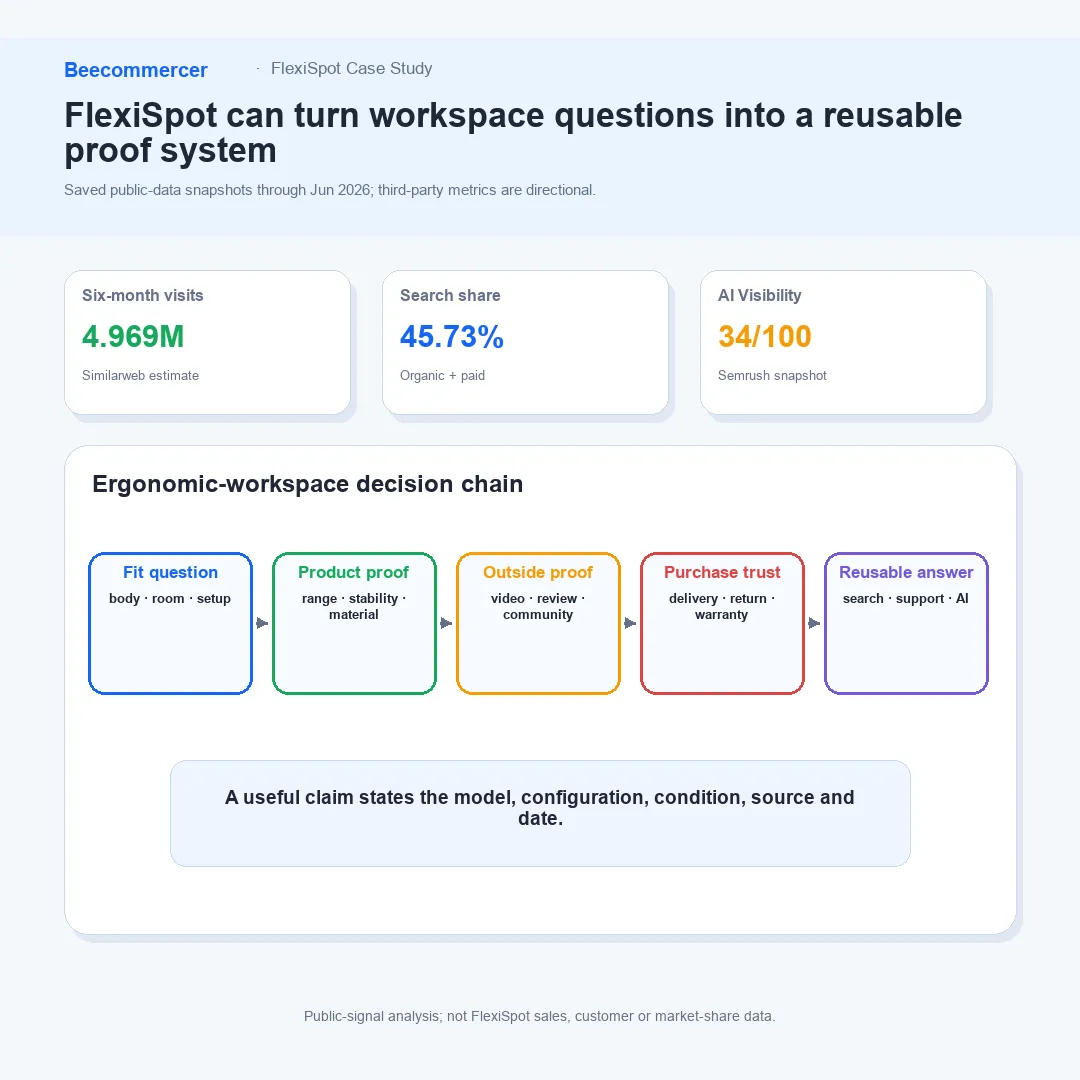
1. FlexiSpot case study: core takeaways
Four findings matter most. First, Similarweb estimates 4.969M visits to flexispot.com from December 2025 through May 2026, with the United States accounting for 69.72% of estimated visits. Second, the saved channel mix is led by search: organic and paid search total 45.73%. Social totals 20.51% from the displayed channel rows, not 23%; affiliates account for 3.44%. Third, search demand clusters around desks, standing desks, E7 and E7 Pro, chairs, reviews, and comparison intent. Fourth, Semrush’s June 24, 2026 Worldwide, All AI Platforms snapshot gives FlexiSpot an AI Visibility score of 34/100, while the supplied US cited-source rows place Reddit, YouTube, and Google ahead of FlexiSpot.com.
The operating implication is to connect the standing-desk range, ergonomic-chair range, E7 Pro, and C7 chair to a common answer layer. Product selection, measurements, setup, stability, materials, warranty, delivery, and returns should be stated in formats that work on product pages, in search, in support, and in AI-generated answers.
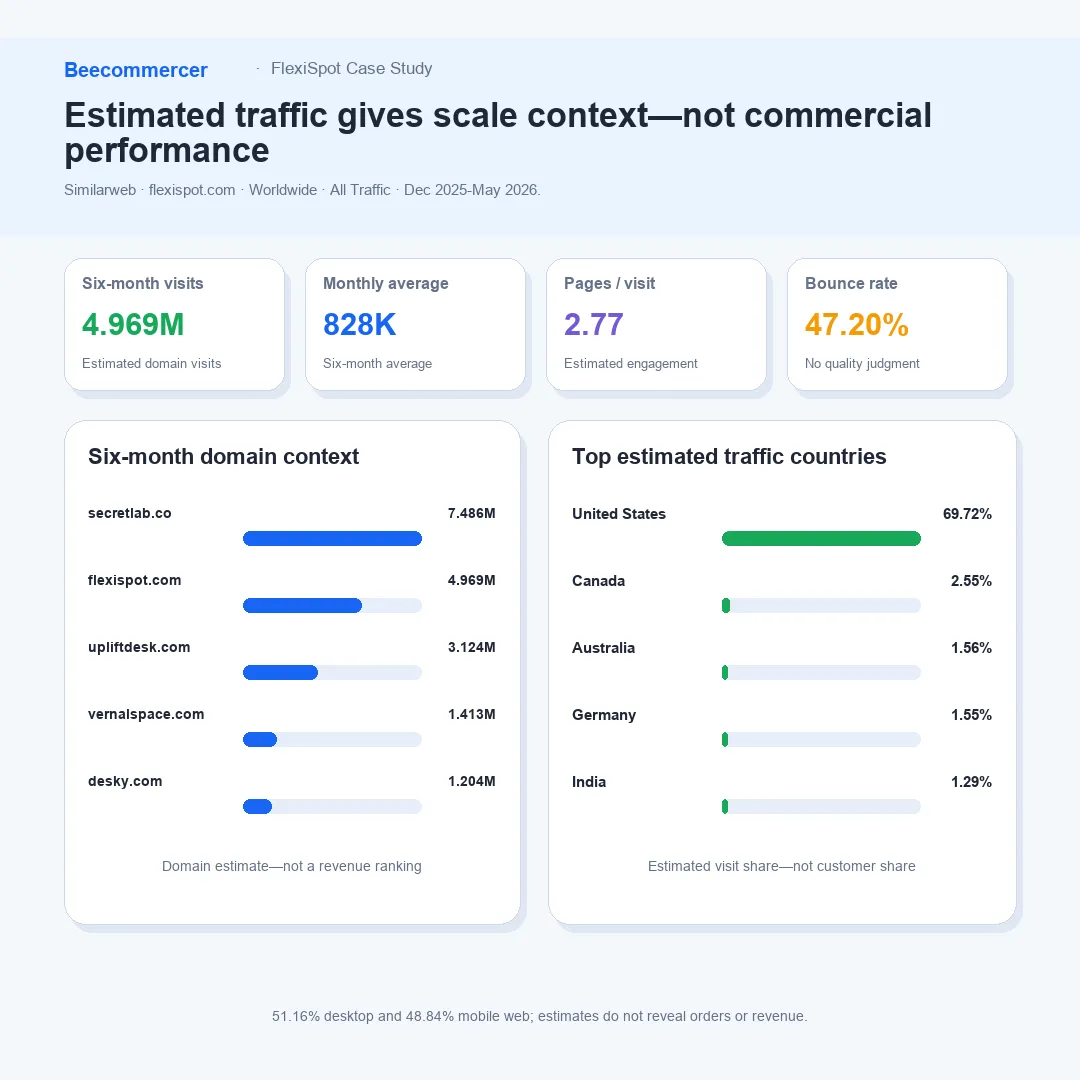
Figure 2 source and scope: Similarweb Website Analysis for flexispot.com, Worldwide, All Traffic, Dec 2025–May 2026. Similarweb explains that website visits and engagement metrics are estimates for the selected domain and scope. Values are directional competitive benchmarks, not FlexiSpot analytics.
2. Scale is meaningful, but US concentration is the sharper risk
Across the saved six-month window, Similarweb estimates 4.969M visits, or roughly 828K per month. The same report shows 2.77 pages per visit, a 1:55 average visit, and a 47.20% bounce rate. In the selected comparison set, Secretlab is larger at an estimated 7.486M visits; FlexiSpot sits above UPLIFT Desk at 3.124M, Vernal at 1.413M, and Desky at 1.204M. These are domain-level estimates—not a ranking of furniture sales or customer preference.
The more important constraint is concentration. The United States represents 69.72% of estimated traffic in this scope, while Canada, Australia, Germany, and India each contribute less than 3%. That makes US proof quality disproportionately important, but it does not automatically identify the best expansion market. FlexiSpot should test localized demand against first-party margin, conversion, inventory, shipping cost, returns, support load, and regulatory requirements before allocating budget.
Device mix is almost even—51.16% desktop and 48.84% mobile web—so the decision experience must work on both. FlexiSpot’s home-office collection spans desks, chairs, walking pads, storage, and accessories; buyers need a compact route from room and body fit to product configuration. The OSHA computer-workstation eTool is also a useful reminder that ergonomics is a system of monitor, keyboard, chair, desk, and working posture—not a single product claim.
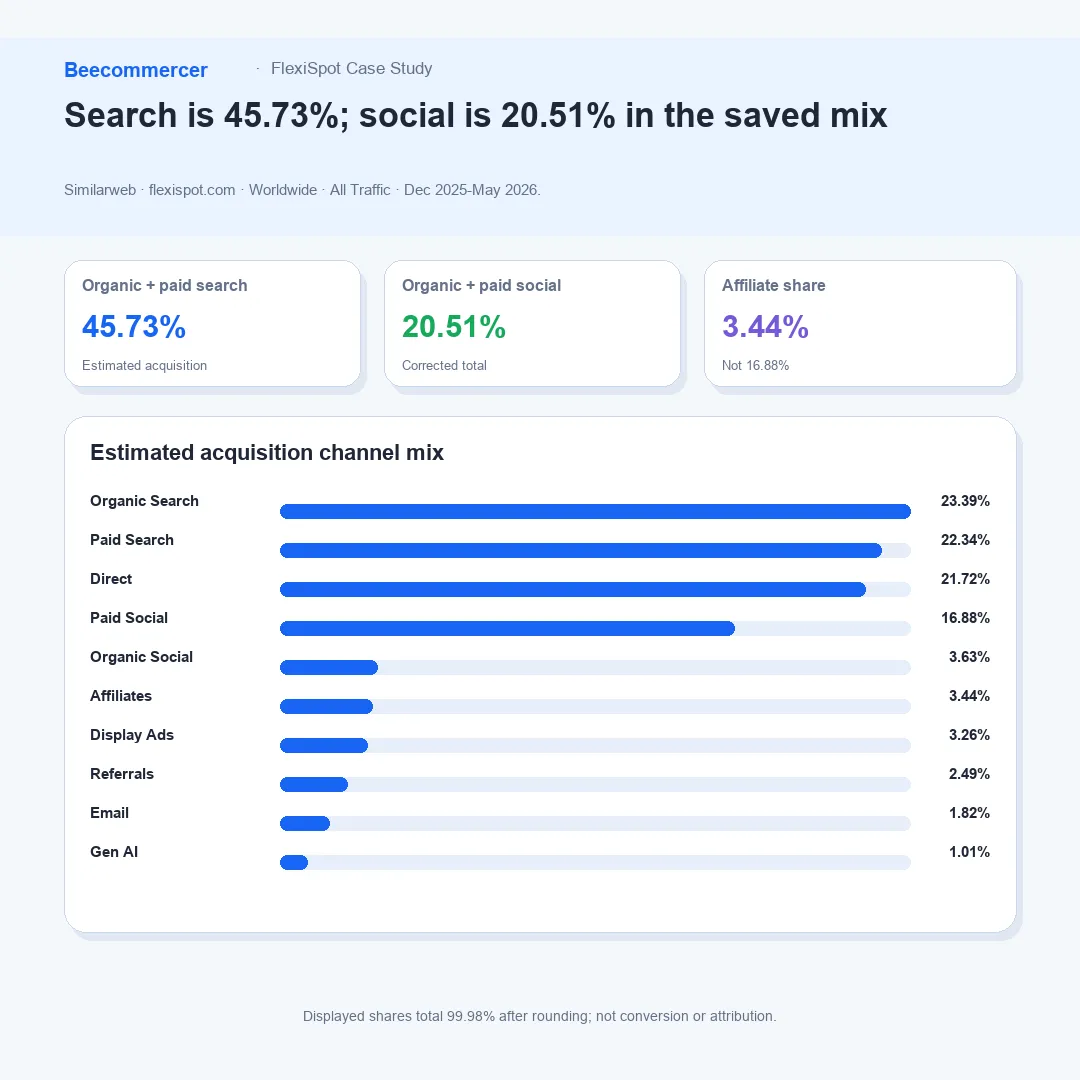
Figure 3 source and scope: Similarweb Website Analysis for flexispot.com, Worldwide, All Traffic, Dec 2025–May 2026. The ten displayed channel shares total 99.98% because of rounding. Similarweb’s separate social panel shows 20.52%, a 0.01-point rounding difference. The estimates describe acquisition visits, not incrementality, conversion, or revenue attribution.
3. Search captures comparison; paid social and video broaden discovery
Organic search contributes 23.39% of estimated visits and paid search another 22.34%, for 45.73% combined. Organic and paid social contribute 3.63% and 16.88%, or 20.51% combined. Within the social subset, YouTube represents 76.47% and Reddit 19.94%. That mix suggests a research path in which a buyer can search for a category or model, watch an assembly or stability demonstration, inspect community experience, and later return through a branded or paid route. It does not prove that every buyer follows that sequence.
FlexiSpot can make those touchpoints more consistent. Its official YouTube channel can demonstrate height range, wobble conditions, noise, tabletop options, cable routing, and assembly. The FlexiSpot community on Reddit can surface recurring questions and edge cases. Both should point back to dated specifications, manuals, comparison tables, warranty terms, and support routes rather than forcing users to reconcile conflicting claims.
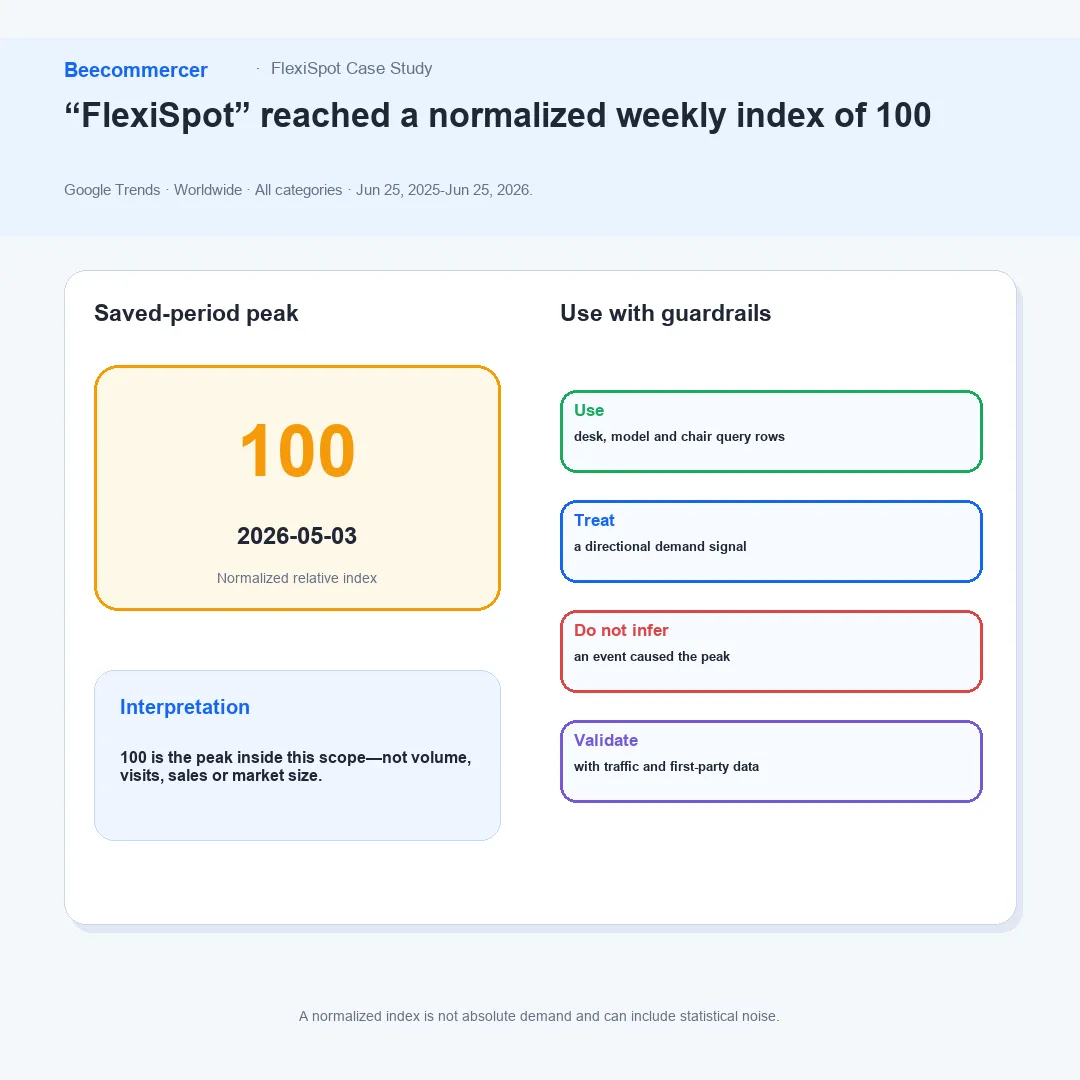
Figure 4 source and scope: Google Trends export for “FlexiSpot,” Worldwide, All categories, Jun 25, 2025–Jun 25, 2026. Google explains that Trends data is sampled, normalized, and scaled from 0 to 100. The index does not equal visits, orders, sales, or market size, and no event is assigned as the cause of the peak.
The peak is a timing signal, not an explanation. It cannot show whether an E7 launch, a promotion, reviews, or an unrelated event produced the change. The related-query export answers a different question: which product and evaluation language appeared around the brand during the selected period.
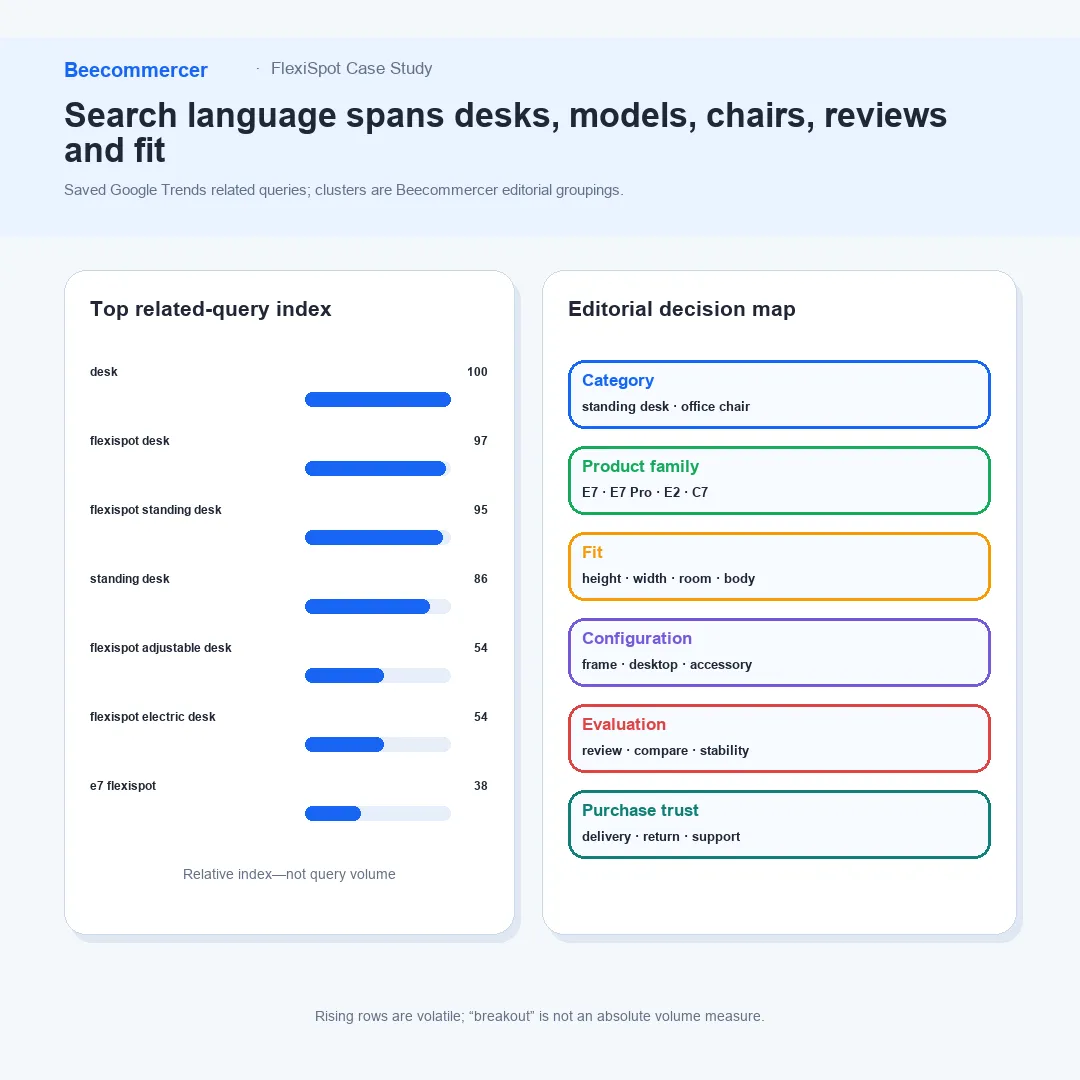
Figure 5 source and scope: Saved Google Trends related-query export for “FlexiSpot,” Worldwide, All categories, Jun 25, 2025–Jun 25, 2026. Query clusters are Beecommercer editorial groupings. Rising terms are directional and can be volatile; “breakout” is not treated as an absolute search-volume figure.
Those clusters turn a brand-level index into a page backlog: category definitions, model comparison, fit, configuration, review evidence, and purchase-risk content. They do not reveal the buyer’s stage or conversion outcome, so the separate Semrush intent view provides a second—still platform-defined—lens.
4. Demand is a portfolio of fit questions, not one standing-desk keyword
Top related searches include “desk,” “flexispot desk,” “flexispot standing desk,” “standing desk,” “flexispot adjustable desk,” “E7 FlexiSpot,” “flexispot chair,” “flexispot E7 Pro,” “flexispot C7,” and “flexispot reviews.” These phrases expose several decision layers: category education, model navigation, desk-versus-chair fit, comparison, and proof of ownership experience.
That distinction should shape site architecture. The E7 page and E7 Pro page can share a comparable specification format; FlexiSpot’s own E7 versus E7 Pro guide can identify which claims need current validation. Category pages should explain height range, desktop compatibility, frame type, stability conditions, motor and controller coverage, while product pages answer precise setup and use questions.
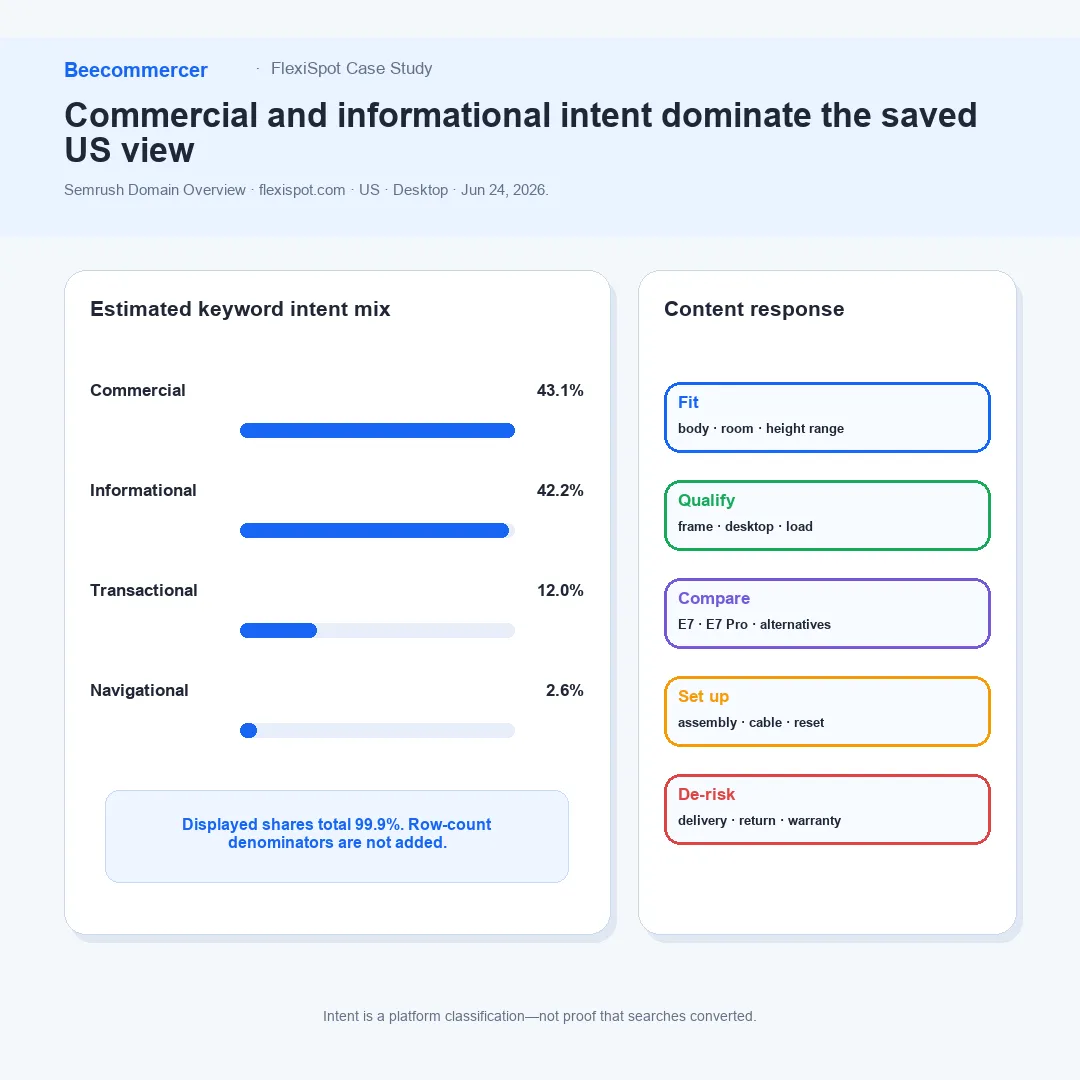
Figure 6 source and scope: Semrush Domain Overview, Organic Research module for flexispot.com, US database, Desktop, Jun 24, 2026. The displayed intent shares are Commercial 43.1%, Informational 42.2%, Transactional 12.0%, and Navigational 2.6%, totaling 99.9% after rounding. Semrush describes its keyword-intent labels; they are platform classifications, not observed customer journeys or conversions.
5. Product content must qualify fit, prove setup, and bound the downside
A workspace product is specification-heavy, but buyers do not purchase a load rating or height range in the abstract. They purchase a desk that fits their body and room, stays stable with their equipment, accepts the chosen desktop, arrives intact, assembles predictably, and can be repaired or returned under known terms. Every important claim should therefore state the model, configuration, measurement method, conditions, source, and update date.
A useful proof ladder would move from fit to risk: user height and seated elbow position; desk height and width range; desktop size and material; frame geometry and load conditions; movement speed and sound; anti-collision behavior; assembly time and tools; then shipping, damage reporting, warranty, and return boundaries. Current claims should link to the relevant product page, manual, or policy. FlexiSpot’s official warranty page and shipping and return policy belong in that decision path, not only in the footer.
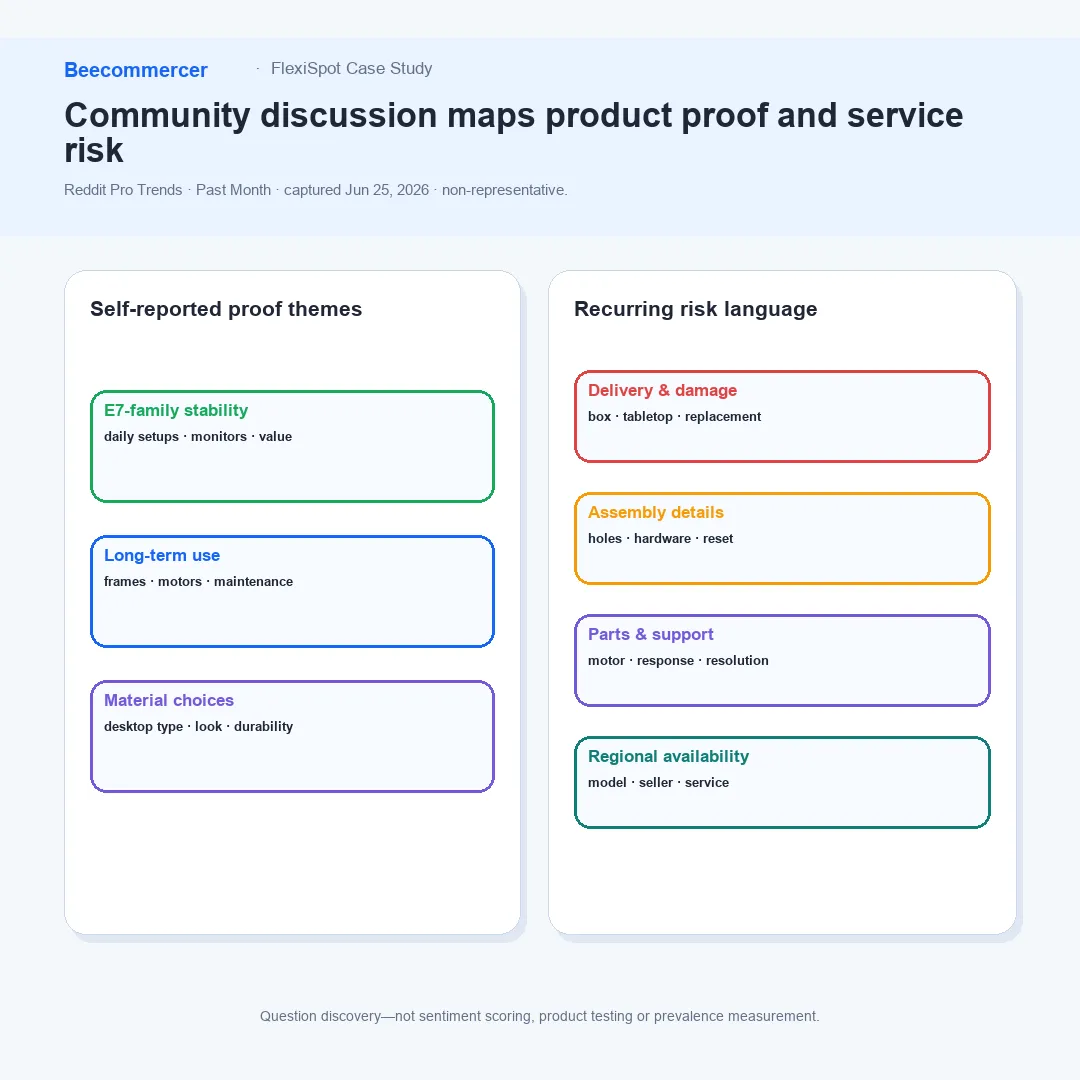
Figure 7 source and scope: Reddit Pro Trends snapshot captured Jun 25, 2026 with a Past Month filter, including visible discussion in r/FlexiSpot_Official, r/StandingDesk, and related contexts. Reddit Pro Trends’ discussion summary is AI-generated from selected popular conversations. The purposive sample is non-representative; posts are paraphrased, not verified product tests or prevalence estimates.
6. Community discussion is a proof backlog, not a sentiment score
The supplied Reddit snapshot includes positive self-reported experience around E7-family stability, long-term use, and value. It also contains questions or complaints about motors, pre-drilled tabletops, material expectations, shipping damage, replacement parts, support, and regional availability. The sample does not support a numerical sentiment conclusion. It does show which product and service claims participants in those selected conversations questioned outside the storefront.
FlexiSpot can turn those themes into a managed answer backlog. Publish model-specific troubleshooting, illustrate acceptable versus defective conditions, state what evidence support needs, and show the next step for damaged deliveries or missing hardware. The existing Spine Care Center demonstrates that the brand can publish educational content; the higher-priority opportunity is to connect that publishing capacity to model comparison, setup, policy, and support questions that directly affect purchase confidence.
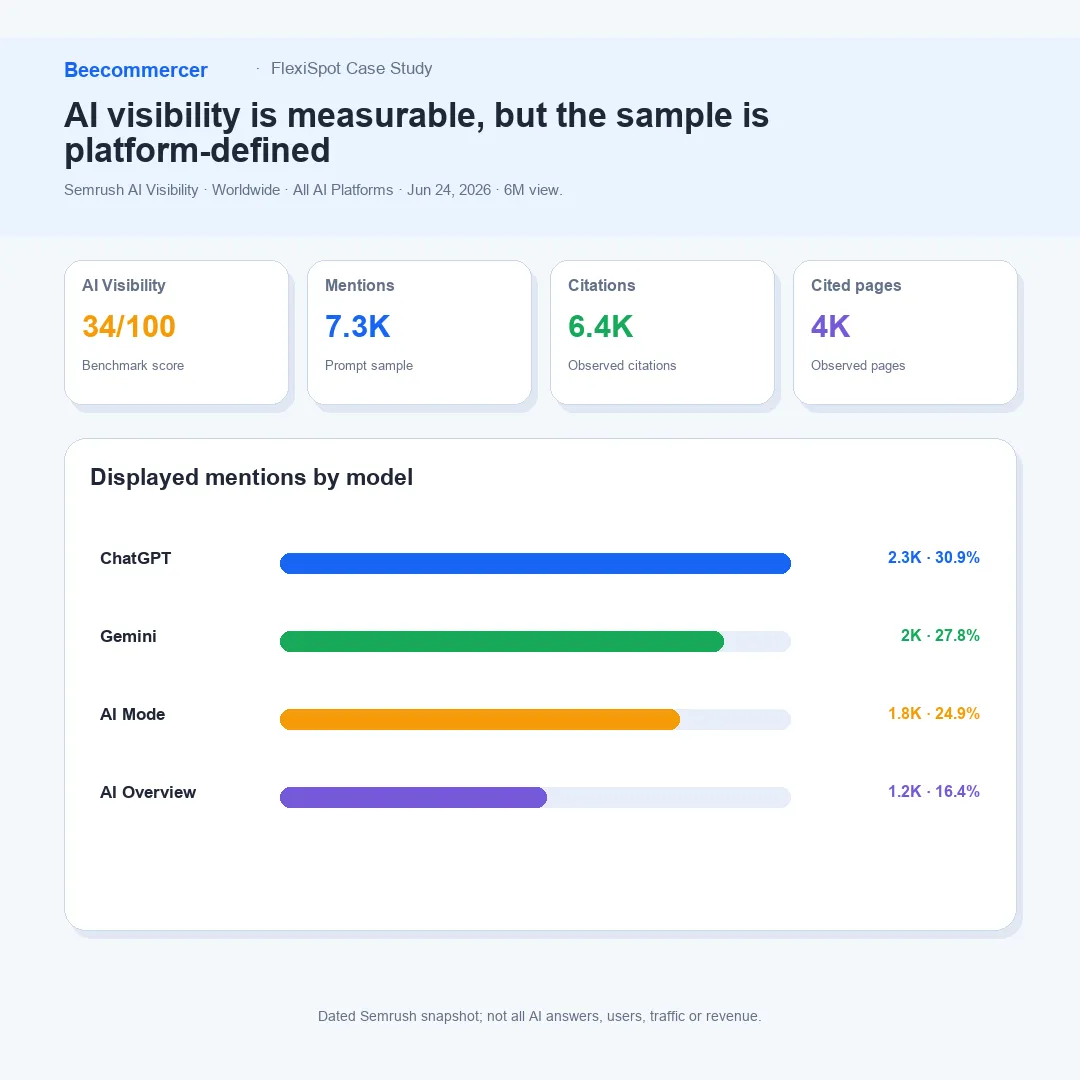
Figure 8 source and scope: Semrush AI Visibility Overview for flexispot.com, Worldwide, All AI Platforms, Jun 24, 2026 with the six-month view selected: AI Visibility 34/100, 7.3K mentions, 6.4K citations, and 4K cited pages. Semrush defines AI Visibility and related metrics and notes that the reports use a platform prompt database.
Visibility quantity does not reveal evidence quality. A brand can appear in a sampled answer while the cited page is outdated, peripheral to the purchase, or controlled by a community, reviewer, retailer, or competitor. The next question is therefore where the sampled answers obtain their support.
The paired cited-source file provides that view for supplied US rows. Its units and country scope differ from the worldwide visibility cards, so the source counts are shown separately and are not added to the 7.3K mention total.
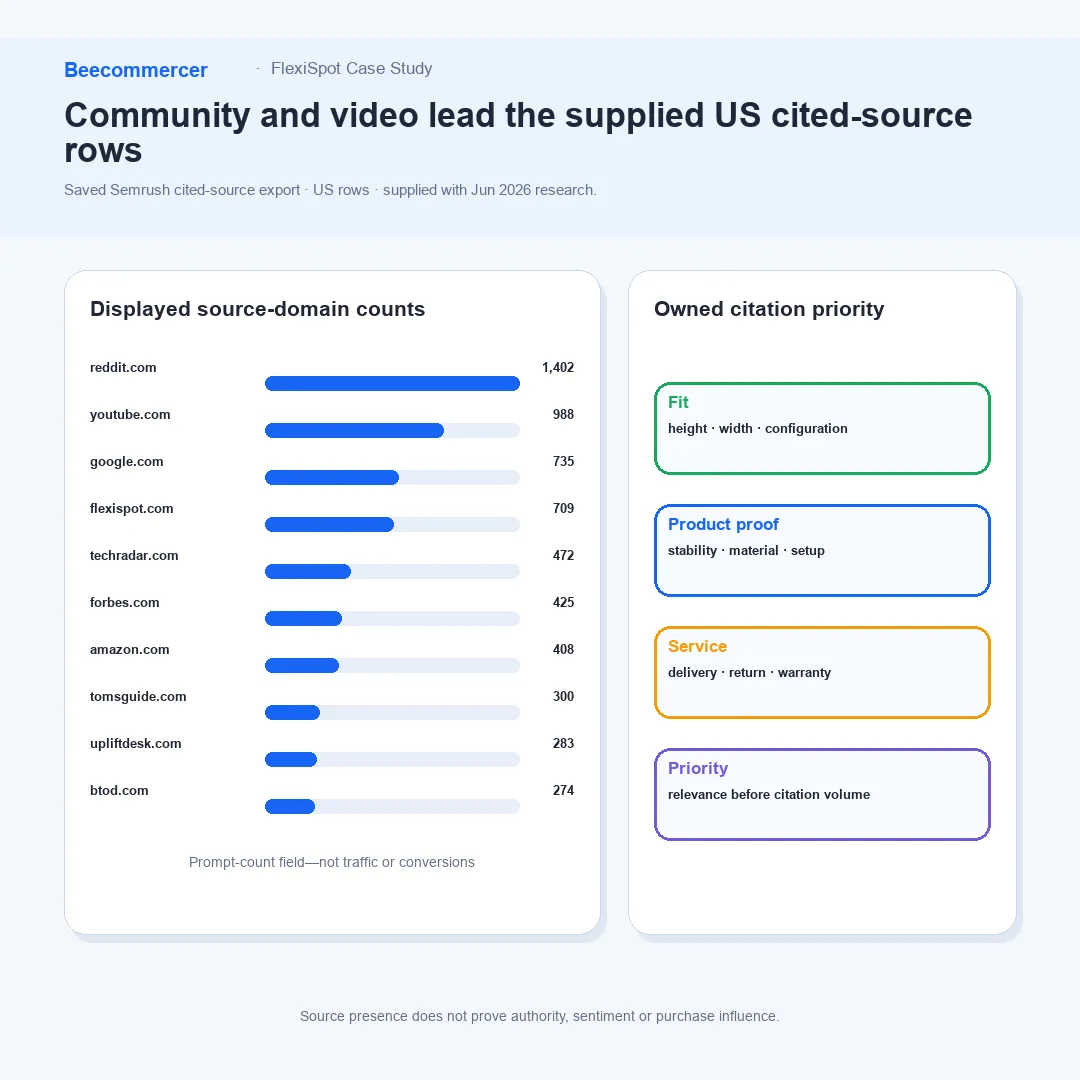
Figure 9 source and scope: Saved Semrush cited-source export for US rows supplied with the Jun 2026 research: Reddit 1,402, YouTube 988, Google 735, FlexiSpot.com 709, TechRadar 472, Forbes 425, Amazon 408, Tom’s Guide 300, UPLIFT Desk 283, and BTOD 274 in the displayed prompt-count field. Source presence is not traffic, sentiment, authority, or proof of purchase influence. Semrush explains the uses and limits of its AI visibility reports.
7. AI visibility is an evidence-distribution problem
Semrush’s dated worldwide snapshot reports AI Visibility of 34/100, 7.3K mentions, 6.4K citations, and 4K cited pages. The displayed model split is ChatGPT 30.9%, Gemini 27.8%, AI Mode 24.9%, and Google AI Overview 16.4%. These are useful as a repeatable benchmark within Semrush’s sample, not as a census of every answer generated by those systems.
The cited-source export reveals the practical challenge: Reddit, YouTube, Google, reviewers, retailers, and competitors can help complete an answer when official product or support content is not sufficient. FlexiSpot should not chase citation volume indiscriminately. It should publish high-intent evidence that others can verify: current model comparisons, dimension and fit guides, stability test conditions, material definitions, assembly steps, troubleshooting, warranty, shipping, and return logic. The company’s about page can explain the brand; the answer layer must explain the decision.
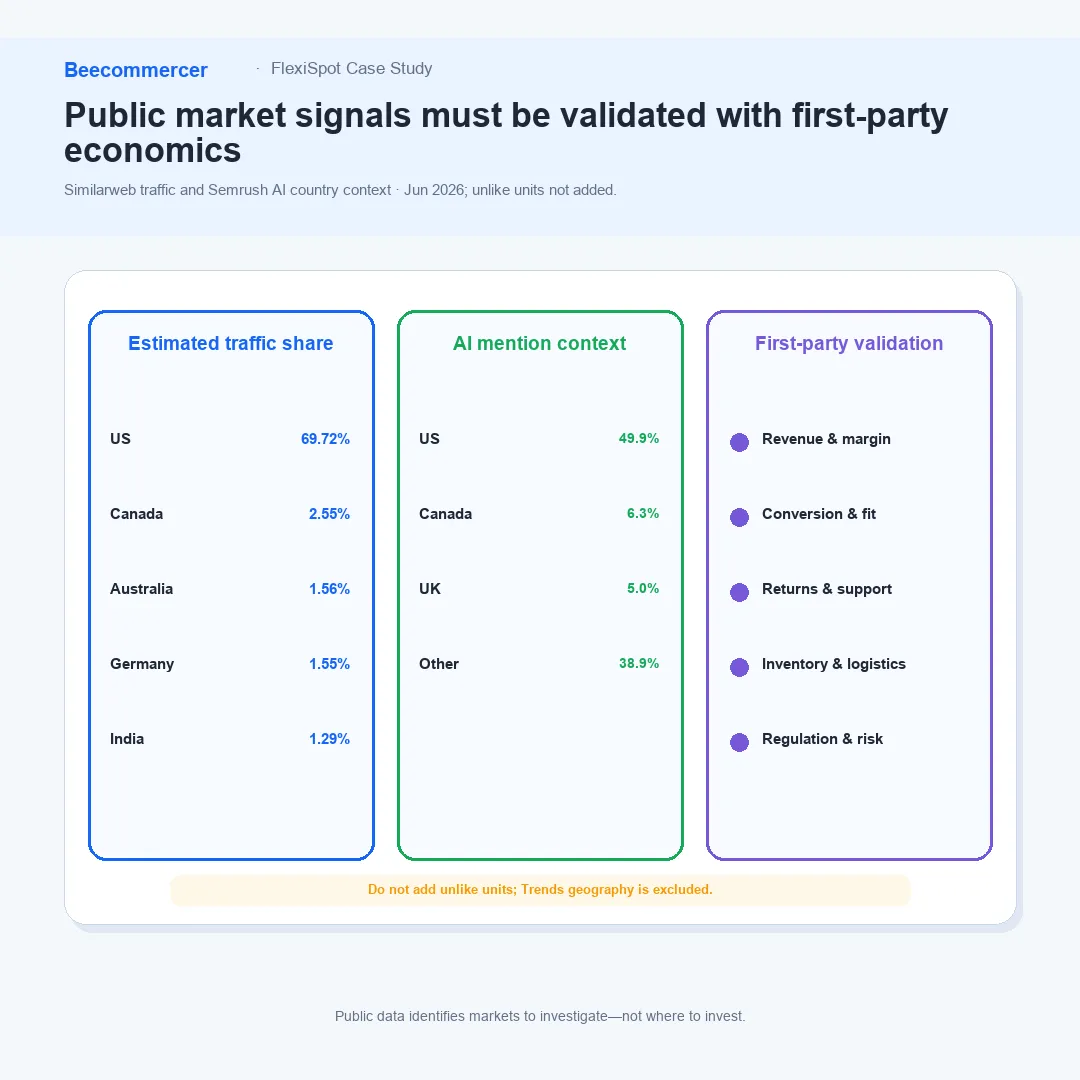
Figure 10 source and scope: Similarweb estimated traffic shares for flexispot.com, Worldwide, Dec 2025–May 2026, plus Semrush AI mention country shares, Jun 24, 2026. The units are shown side by side and are not added. Google Trends geography is excluded from prioritization because normalized regional interest is not demand volume. Market decisions require first-party revenue, margin, conversion, returns, support, logistics, and regulatory data.
8. A 90-day growth plan: build the ergonomic-workspace proof loop
Days 1–30: map the decision. Join Search Console queries, paid-search terms, onsite search, configurator behavior, support tickets, returns, product reviews, affiliate coverage, and community questions. Assign every recurring concern to a model, configuration, market, and funnel stage. Audit each dimension, stability, material, warranty, and delivery claim for its source and update date.
Days 31–60: publish the answer layer. Build an E7-family comparison hub, desk selector, body-and-room fit guide, desktop material guide, standardized specification blocks, visual assembly pages, delivery-damage workflow, warranty summary, and concise FAQs. Separate measured facts, brand claims, reviewer observations, and user reports so readers can see what each piece of evidence establishes.
Days 61–90: distribute and measure. Turn the same verified evidence into YouTube demonstrations, affiliate briefs, retailer modules, support macros, and community responses. Measure qualified product-page landings, selector completion, comparison-to-product clicks, assisted conversion, return reasons, damage rate, and support-contact rate. Track Semrush AI metrics as a secondary visibility indicator—not as the business outcome.
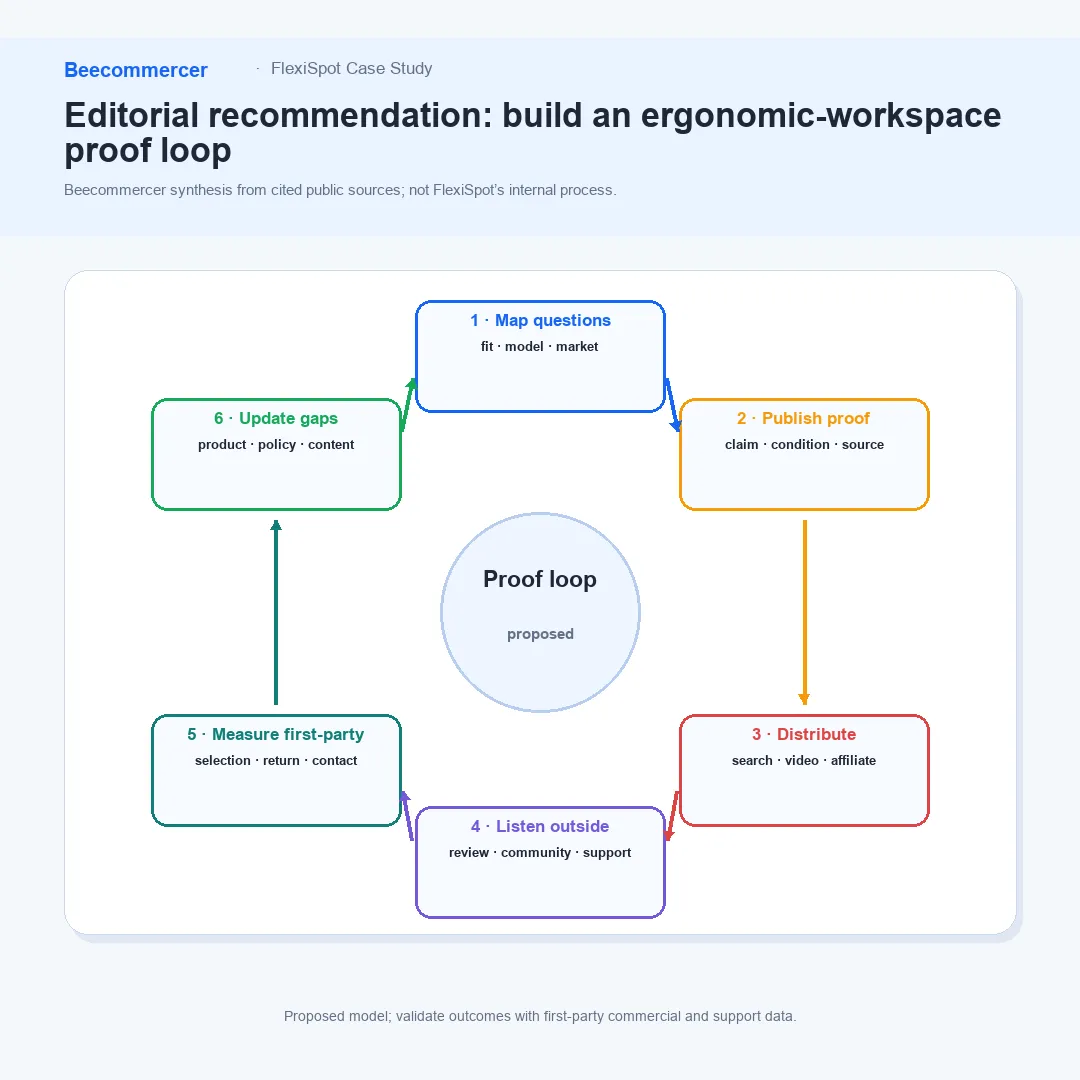
Figure 11 source and scope: Beecommercer editorial synthesis based on the cited Similarweb, Semrush, Google Trends, Reddit, OSHA, and official FlexiSpot sources. This is a proposed operating model, not FlexiSpot’s disclosed internal process. Outcomes must be validated with FlexiSpot’s first-party commercial and support data.
9. FlexiSpot case study FAQ
What is the main growth lesson from this FlexiSpot case study?
FlexiSpot can make acquisition more efficient by turning recurring fit, stability, material, assembly, delivery, warranty, and support questions into sourced answer assets that work across search, product pages, video, reviews, support, and AI-generated answers.
Does 4.969M estimated visits mean FlexiSpot made 4.969M sales?
No. Similarweb’s 4.969M figure is an estimate of visits to flexispot.com during the six-month scope, not unique customers, orders, conversion, revenue, or market share.
Is social traffic 23% in the supplied FlexiSpot data?
No. The displayed organic-social and paid-social rows total 20.51%; Similarweb’s separate social panel shows 20.52% because of rounding. The 23.39% figure belongs to organic search, while affiliates account for 3.44%.
What should FlexiSpot publish first for SEO and AI visibility?
Start with a current E7-family comparison, a desk selector, fit and dimension guidance, stability test conditions, desktop-material explanations, visual setup and troubleshooting, delivery and return workflows, warranty summaries, and concise FAQs with a source and update date.
10. Full methodology and editorial note
This article uses saved public-data snapshots supplied for editorial analysis: Similarweb Website Analysis for flexispot.com (Worldwide, All Traffic, Dec 2025–May 2026); Semrush Domain Overview and AI Visibility screenshots dated Jun 24, 2026; Semrush CSV exports whose rows include country scope but no snapshot-date column; Google Trends for “FlexiSpot” (Worldwide, All categories, Jun 25, 2025–Jun 25, 2026); and a Reddit Pro Trends sample captured Jun 25, 2026. Similarweb values are estimates interpreted under its data-methodology guidance. Semrush values are platform-defined estimates or counts from its databases and prompt sample; its Domain Overview documentation explains the report context. Google Trends is a normalized index. Reddit observations are purposive and non-representative.
Official FlexiSpot pages are cited for current product taxonomy, brand claims, product specifications, educational content, and policy context. They are primary sources for what FlexiSpot publishes, not independent validation of product performance. Beecommercer’s clusters, interpretations, market framework, and 90-day plan are editorial analysis. No first-party FlexiSpot analytics, sales, customer, margin, conversion, return, damage, or support dataset was available, so the article does not claim causality or business impact.