

Last updated on November 4, 2026 at 10:07 AM
Paid social is entering the holiday season with a simple but uncomfortable question: when advertising costs rise, is a brand buying more demand or merely paying more to reach the same customer? Metricool’s November 3 Social Ads Benchmarks 2026 article offers a useful lens. Its global dataset suggests Meta advertisers are committing more budget per campaign even as reported Sales ROAS has slipped, while TikTok looks considerably cheaper for awareness, traffic and lead generation. The tension is that campaign-level averages are not a substitute for margin, customer quality or controlled channel tests. A cheaper click may be a bargain, a distraction or an expensive purchase in disguise.
THE BIG STORY | PAID SOCIAL ECONOMICS
The Wrong Benchmark Can Make a Healthy Campaign Look Broken
What 629,000 campaigns actually tell us
Metricool analyzed 628,969 paid campaigns from 44,355 advertisers worldwide, representing $471.5 million in spend across Meta and TikTok. The underlying research compares January–June 2025 with the same six months in 2026; the study was released in September, and its November 3 benchmark article translates the findings into practical reference points. Most figures are campaign averages, not a market-wide price quote, and the advertiser pool includes varied countries, budgets and objectives. Currency conversion used a consistent exchange-rate convention. These are meaningful observed patterns—but not an experiment in which the same brand ran otherwise-identical ads on both platforms.
The objective distinction matters more than it first appears. An Awareness CPM is the cost per thousand impressions; a Traffic CPC is the price of a click; a Leads CTR describes response to a lead-generation ad. None should be read as the price of acquiring a paying customer. Even an overall platform average becomes misleading if it mixes regions, audiences, placements and purchase stages. Use the snapshot below as a starting reference, not a cross-platform winner’s podium.
| Benchmark | Campaign objective | Meta | TikTok |
|---|---|---|---|
| CPM | Awareness / Reach | USD 0.48 | USD 0.38 |
| CPC | Traffic | USD 0.07 | USD 0.03 |
| CTR | Leads | 2.04% | 0.75% |
| Cost per lead | Leads | USD 6.00 | USD 2.69 |
| Engagement rate | Engagement | 2.15% | 1.99% |
| Avg. spend / campaign | All objectives | USD 718 | USD 1,309 |
Benchmark scope: metric-specific campaign objectives; averages per campaign, January–June 2026. These are not ecommerce-only rates or comparable purchase ROAS on both platforms. Monetary figures are in U.S. dollars. Engagement rate in this report is interactions divided by reach.
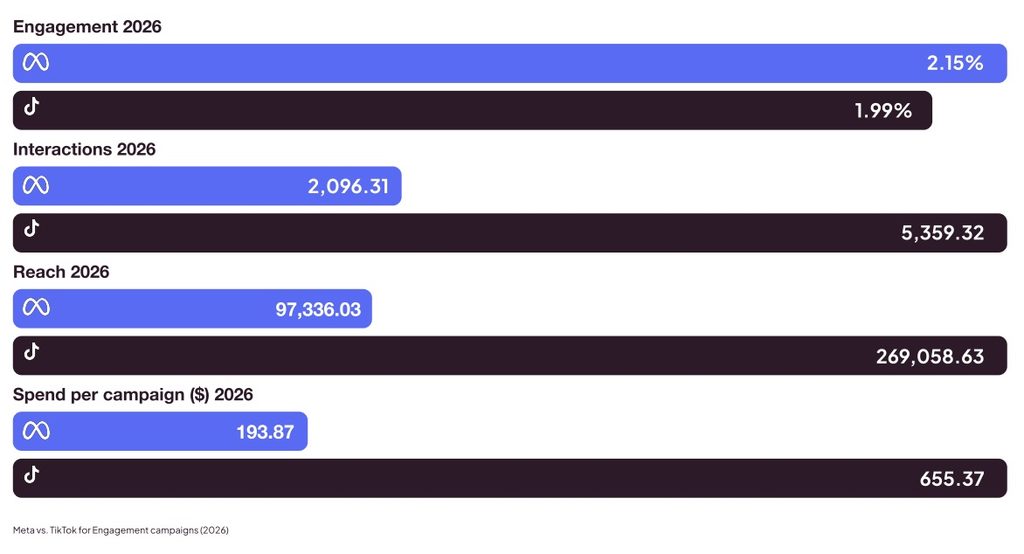
Image source: Metricool
Meta’s spending increase is not the same as stronger returns
The sharpest signal is the difference between spending growth and advertising return. Average Meta spend per campaign rose 47%, from $489.53 in the first half of 2025 to $718.45 in the first half of 2026. Yet reported ROAS for Meta Sales campaigns fell from 5.48x to 4.57x—roughly a 17% decline. Those figures do not prove that every advertiser became less profitable: 4.57x is an attributed-revenue ratio, not contribution profit, and the ROAS calculation covers only the nearly two-thirds of Meta Sales campaigns that report purchase value.
The funnel explains part of the tension. Around two-thirds of Meta campaigns pursued Traffic or Engagement, but over 70% of spend went to bottom-funnel objectives; Sales campaigns consumed over 40% of budget despite accounting for only about one in ten campaigns. In other words, campaign counts can make a portfolio look diversified while the actual dollars remain heavily concentrated on conversion. Brands should be wary of scaling an apparently successful purchase campaign without checking incremental new customers, discount dependency, repeat purchases and whether the next dollar is earning the same return as the last.
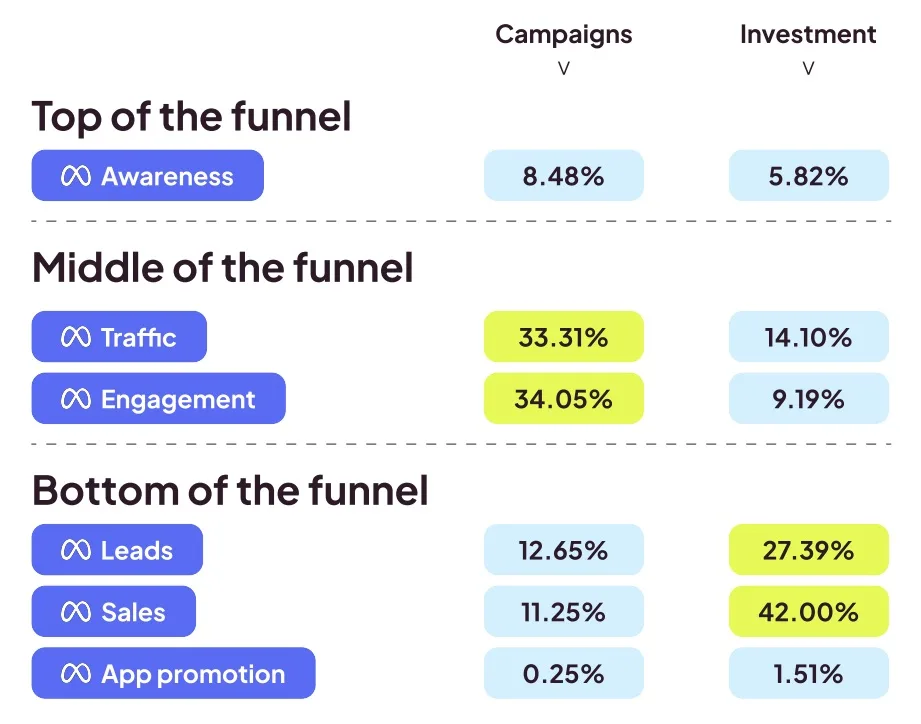
Image source: Metricool
TikTok looks cheaper—but cheap traffic is not a profit forecast
TikTok’s average Traffic CPC was $0.03, compared with Meta’s $0.07, and the Leads cost per lead was $2.69 against $6.00. TikTok’s Awareness / Reach CPM also averaged $0.38 versus $0.48 for Meta. On these narrowly defined objectives, the cost advantage is material. However, the Leads comparison contains a useful twist: Meta recorded a 2.04% click-through rate versus 0.75% for TikTok, while TikTok turned a larger share of its clicks into submitted leads. An ad can attract fewer clicks yet deliver a cheaper lead because the downstream step performs differently.
There is no equivalent TikTok purchase-ROAS figure in Metricool’s public benchmark summary, so the table cannot answer which platform produces more ecommerce profit. Nor should advertisers confuse a campaign’s click cost with the cost of qualified landing-page visits. A real comparison needs the same geography, audience intent, attribution window, offer, shipping proposition and definition of a conversion. One testable hypothesis is that Meta may work well with existing, ready-to-buy shoppers while TikTok may offer inexpensive discovery and creative testing. The benchmark does not establish either advantage for an individual merchant.
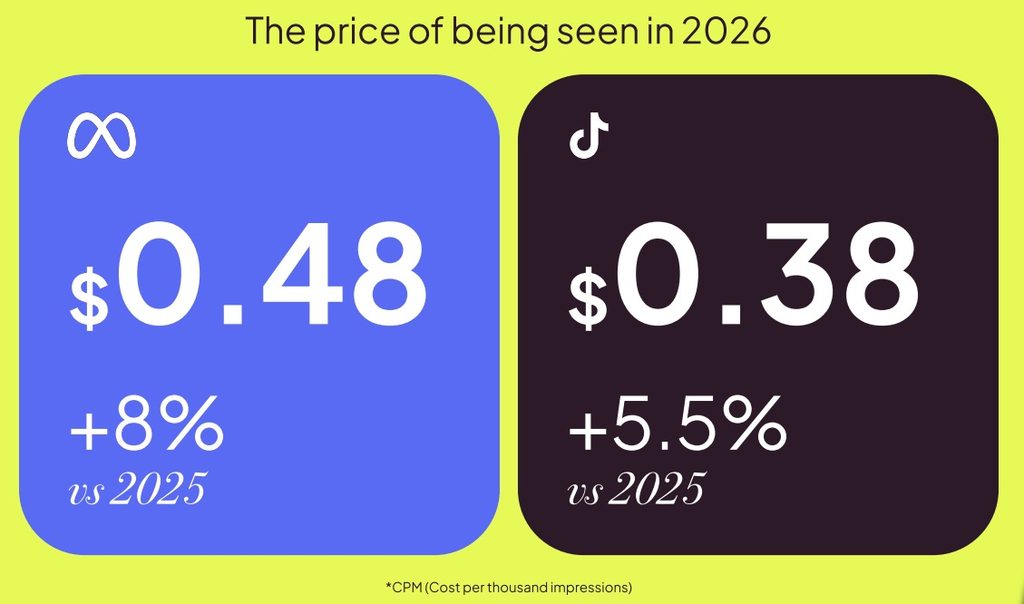
Image source: Metricool
The market is concentrated, but the next test need not be
Metricool reports 91% of advertisers in its dataset used Meta alone; 5% used TikTok alone and just 4% used both. Among brands running both, TikTok’s share of combined spending moved from 23.6% in 2025 to 25.7% in 2026. That is a signal of experimentation by a relatively small cross-platform cohort, not evidence that the entire market has shifted its budgets. Selection also matters: TikTok campaigns in this sample averaged about $1,309 in spend, versus $718 on Meta. Comparing raw campaign outcomes across differently sized advertisers can create a misleading efficiency story.
For ecommerce, the purchasing journey is not uniformly in-app either. In a separate Metricool study of 72 leading U.S. brands, about 6% of their TikTok posts, including paid and organic content, carried a TikTok Shop product tag in August 2026. This narrower sample should not be extrapolated to all merchants, but it is a reminder that a short-form video can drive discovery and still send the shopper to a retailer or independent website. The merchant’s landing experience, product feed, pricing, checkout and lifecycle messaging remain important after the social impression.
A better 30-day benchmark for an ecommerce advertiser
Start with a matched scorecard, not a platform ranking. Segment your own Meta and TikTok campaigns by country, objective, new versus returning customers, broad product category and creative type. For awareness, pair CPM with unique reach and frequency. For traffic, add engaged landing sessions and product-page depth to CPC. For lead generation, compare verified or qualified leads rather than submissions alone. For purchase campaigns, use orders, net revenue, new-customer acquisition cost, gross margin after returns and a consistent attribution convention.
Then run a bounded creative-and-channel test. Use the same offer and landing page where appropriate, test distinct hooks and product demonstrations, and hold enough budget constant to detect a useful change. Keep prospecting separate from remarketing, and do not credit an upper-funnel platform with every later search purchase. If a holdout is practical, use it; if not, label ROAS and blended revenue trends as directional rather than proof of incrementality. The correct outcome is not to force both platforms to the same CPC. It is to identify which combination produces repeatable contribution profit at an acceptable cost of customer acquisition.
What to watch as Q4 campaigns scale
These benchmarks describe the first half of 2026, not Black Friday auctions. Seasonal competitive pressure, creative fatigue, changes in conversion tracking and a larger promotional mix may all move performance in the holiday quarter. Watch for comparable second-half data, ecommerce-only country cuts, and stronger reporting of purchase quality on TikTok. Above all, treat the Meta ROAS decline as a reason to investigate marginal efficiency—not as permission to slash budgets—and treat TikTok’s low CPC as an invitation to test, not a guaranteed return.
TREND WATCH | WHAT ELSE MOVED
Google Ads adds context to the conversion scorecard
A Search Engine Land field review explains Google’s attributed branded searches as an awareness-to-search signal for YouTube and Demand Gen, not a sale or lift study. Separately, an Adalysis analysis of 5,900+ accounts found that higher Ad Strength ads did not consistently outperform on conversion rate; pinning and selection deserve scrutiny. Google also updated guidance on how PMax may prioritize brand queries for dedicated Search campaigns. Build forecasts from demand and margin signals, not an account-wide CPC assumption.
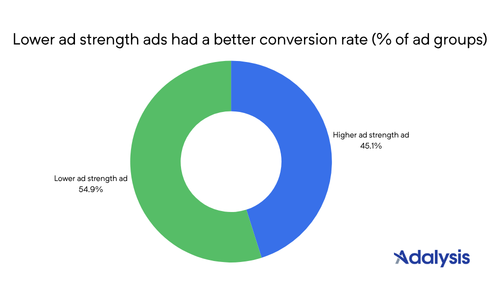
Image source: Adalysis
AI-assisted SEO needs controls, local facts and outside authority
New guidance on managed automation, global content operations and AI-built sites points to the same operational discipline: automate repeatable analysis, but review factual accuracy, indexability, canonical rules and local market fit before publishing. Semrush makes a related argument that substantive affiliate reviews and comparisons can influence brand mentions in AI answers. Its affiliate-visibility evidence is useful as a planning hypothesis, not a promise that every partner article will receive citations.
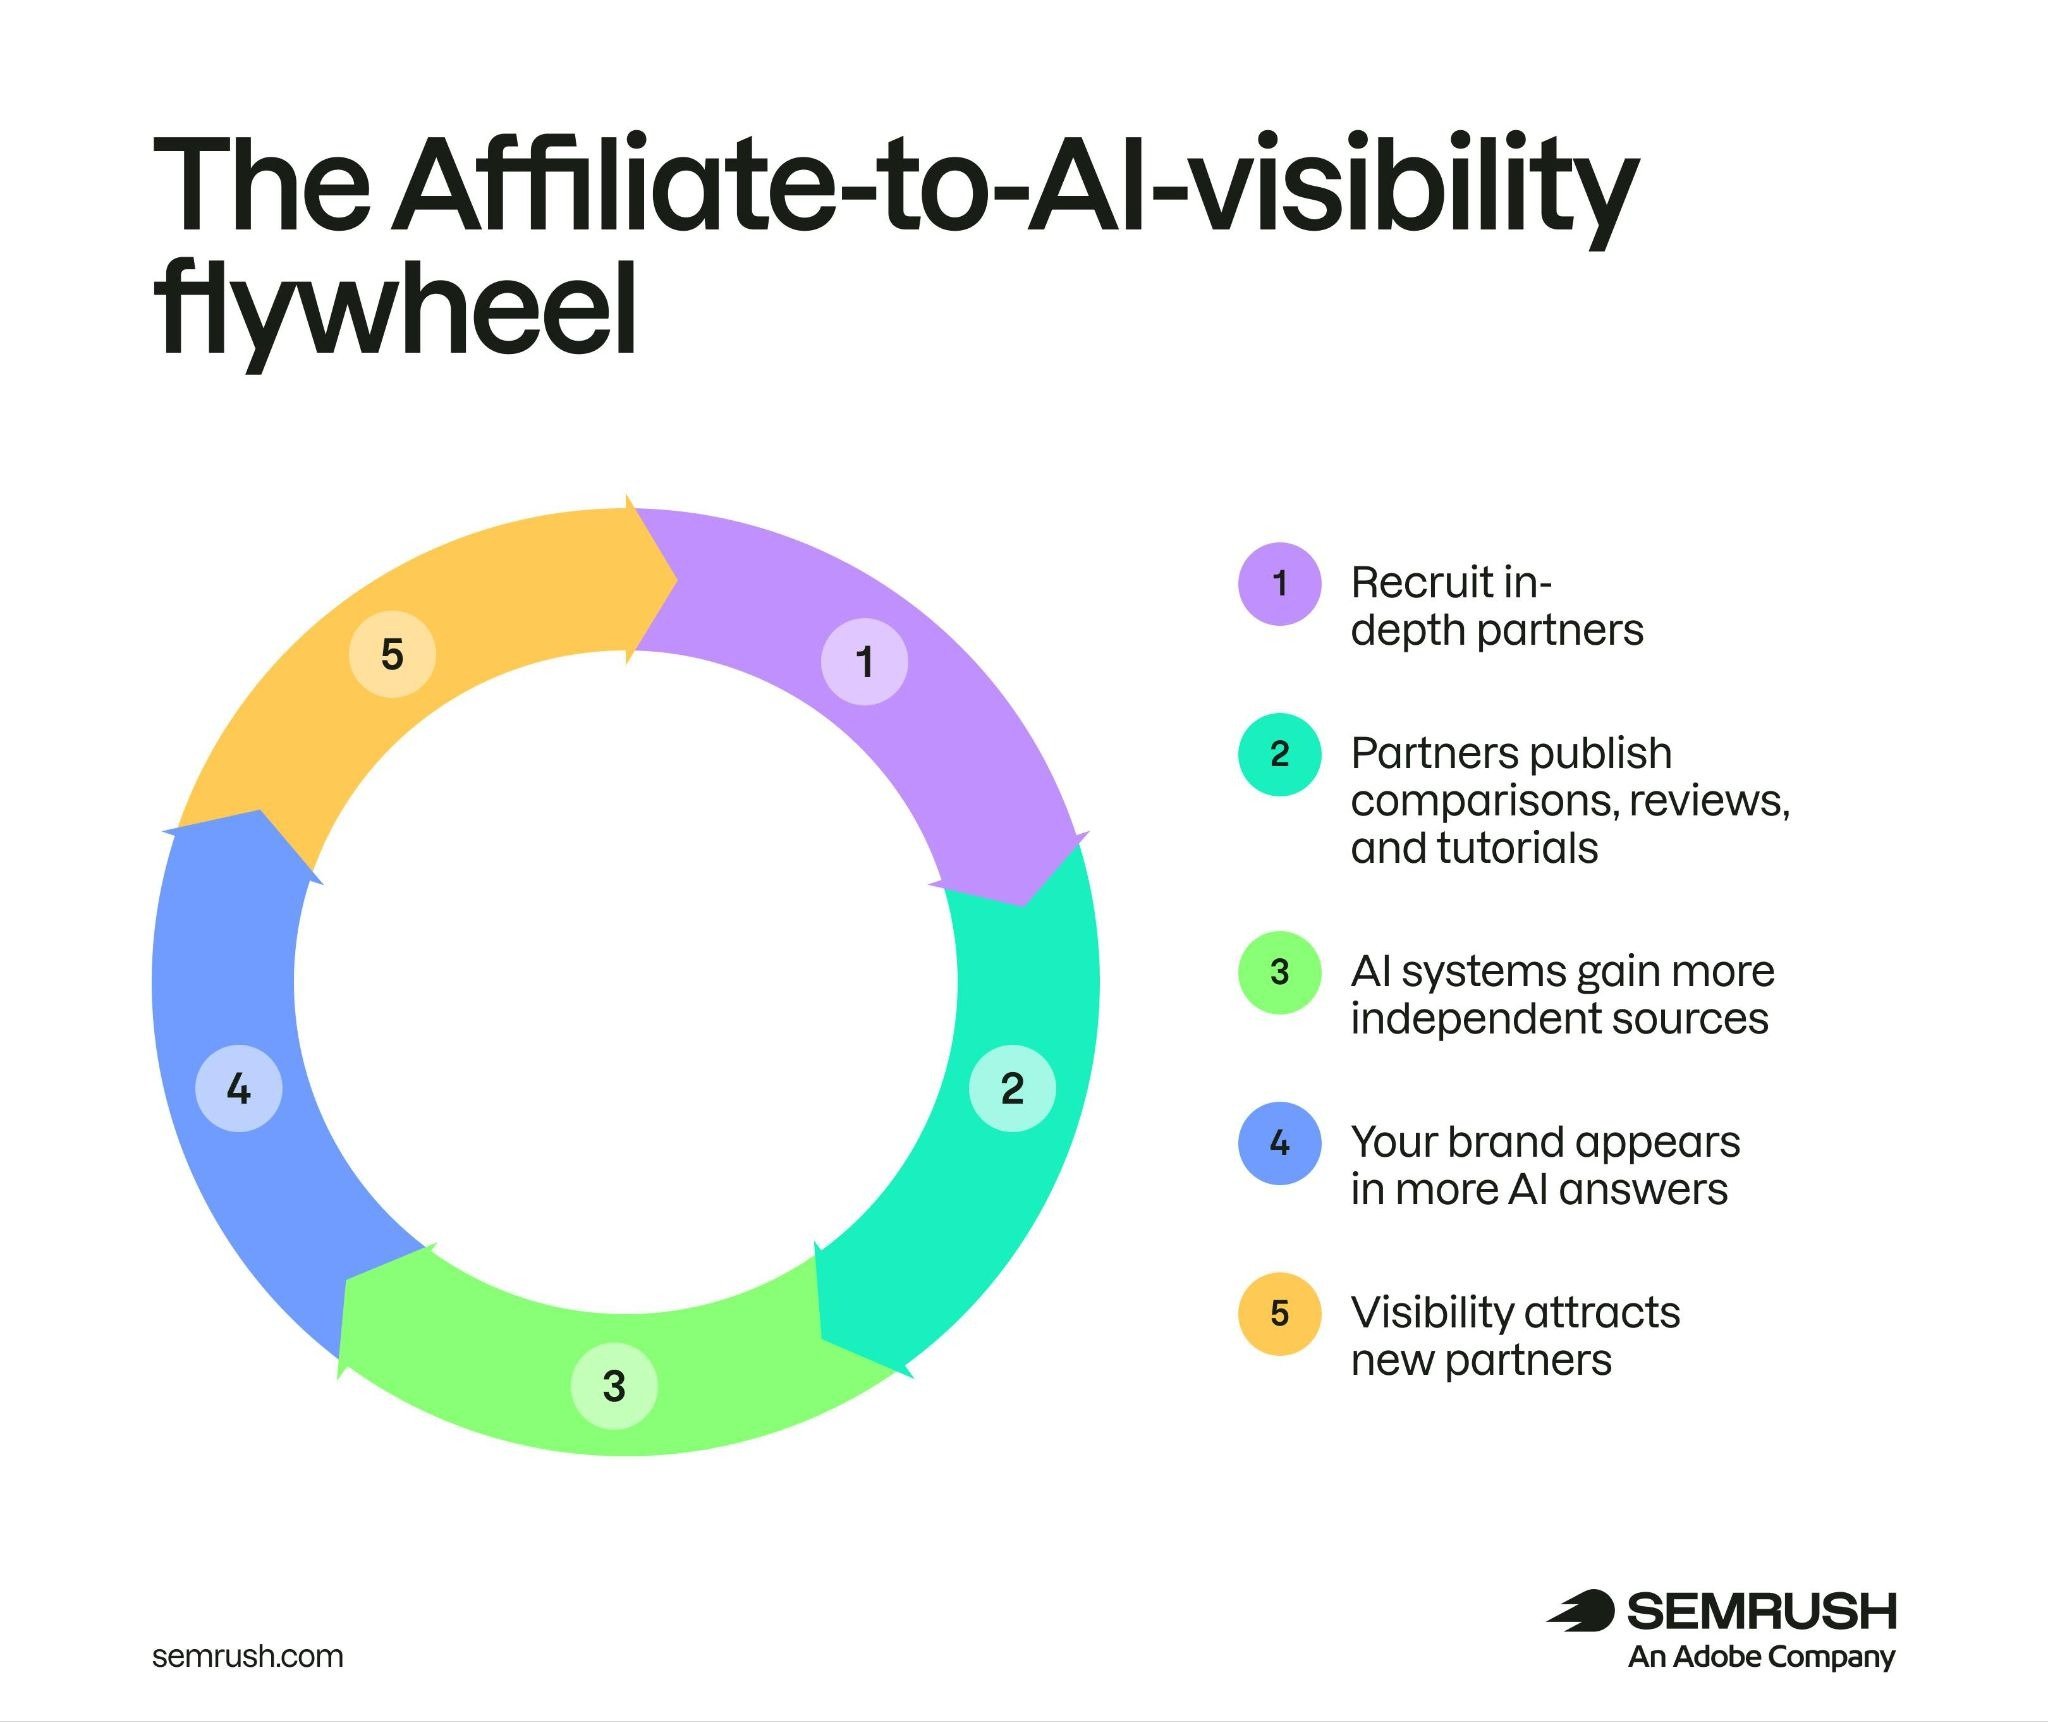
Image source: Semrush
Video growth is also a credibility and audience-fit problem
Google’s YouTube Festival briefing describes creator trust and long-form-to-short-form viewing across Australia and New Zealand; a video-statistics guide collects broader campaign research. TikTok said that by July 2026 it had labeled more than 3 billion AI-generated or substantially AI-edited videos and emphasizes disclosure. Meanwhile, a survey reported by EMARKETER found that, among U.S. digital buyers surveyed, those aged 35–54 were more likely than those aged 18–34 to have bought clothing online in the previous month. Creative, transparency and audience assumptions deserve separate tests.

Image source: Google / Think with Google
Measurement infrastructure and retention still set the ceiling
Search Engine Journal reports that Google has scheduled a change for January 11, 2027: advertising tags in server-side GTM will receive full IP addresses by default, while Analytics tags retain redaction. Review the planned change against privacy and consent requirements; it is not a tracking shortcut to enable indiscriminately. G2’s email-automation guide argues for trigger-based welcome and cart-recovery flows, then testing performance across the customer lifecycle. Digiday’s member-only ad-tech analysis adds context to the wider AI transition, but its restricted detail is not treated here as independently verified reporting.
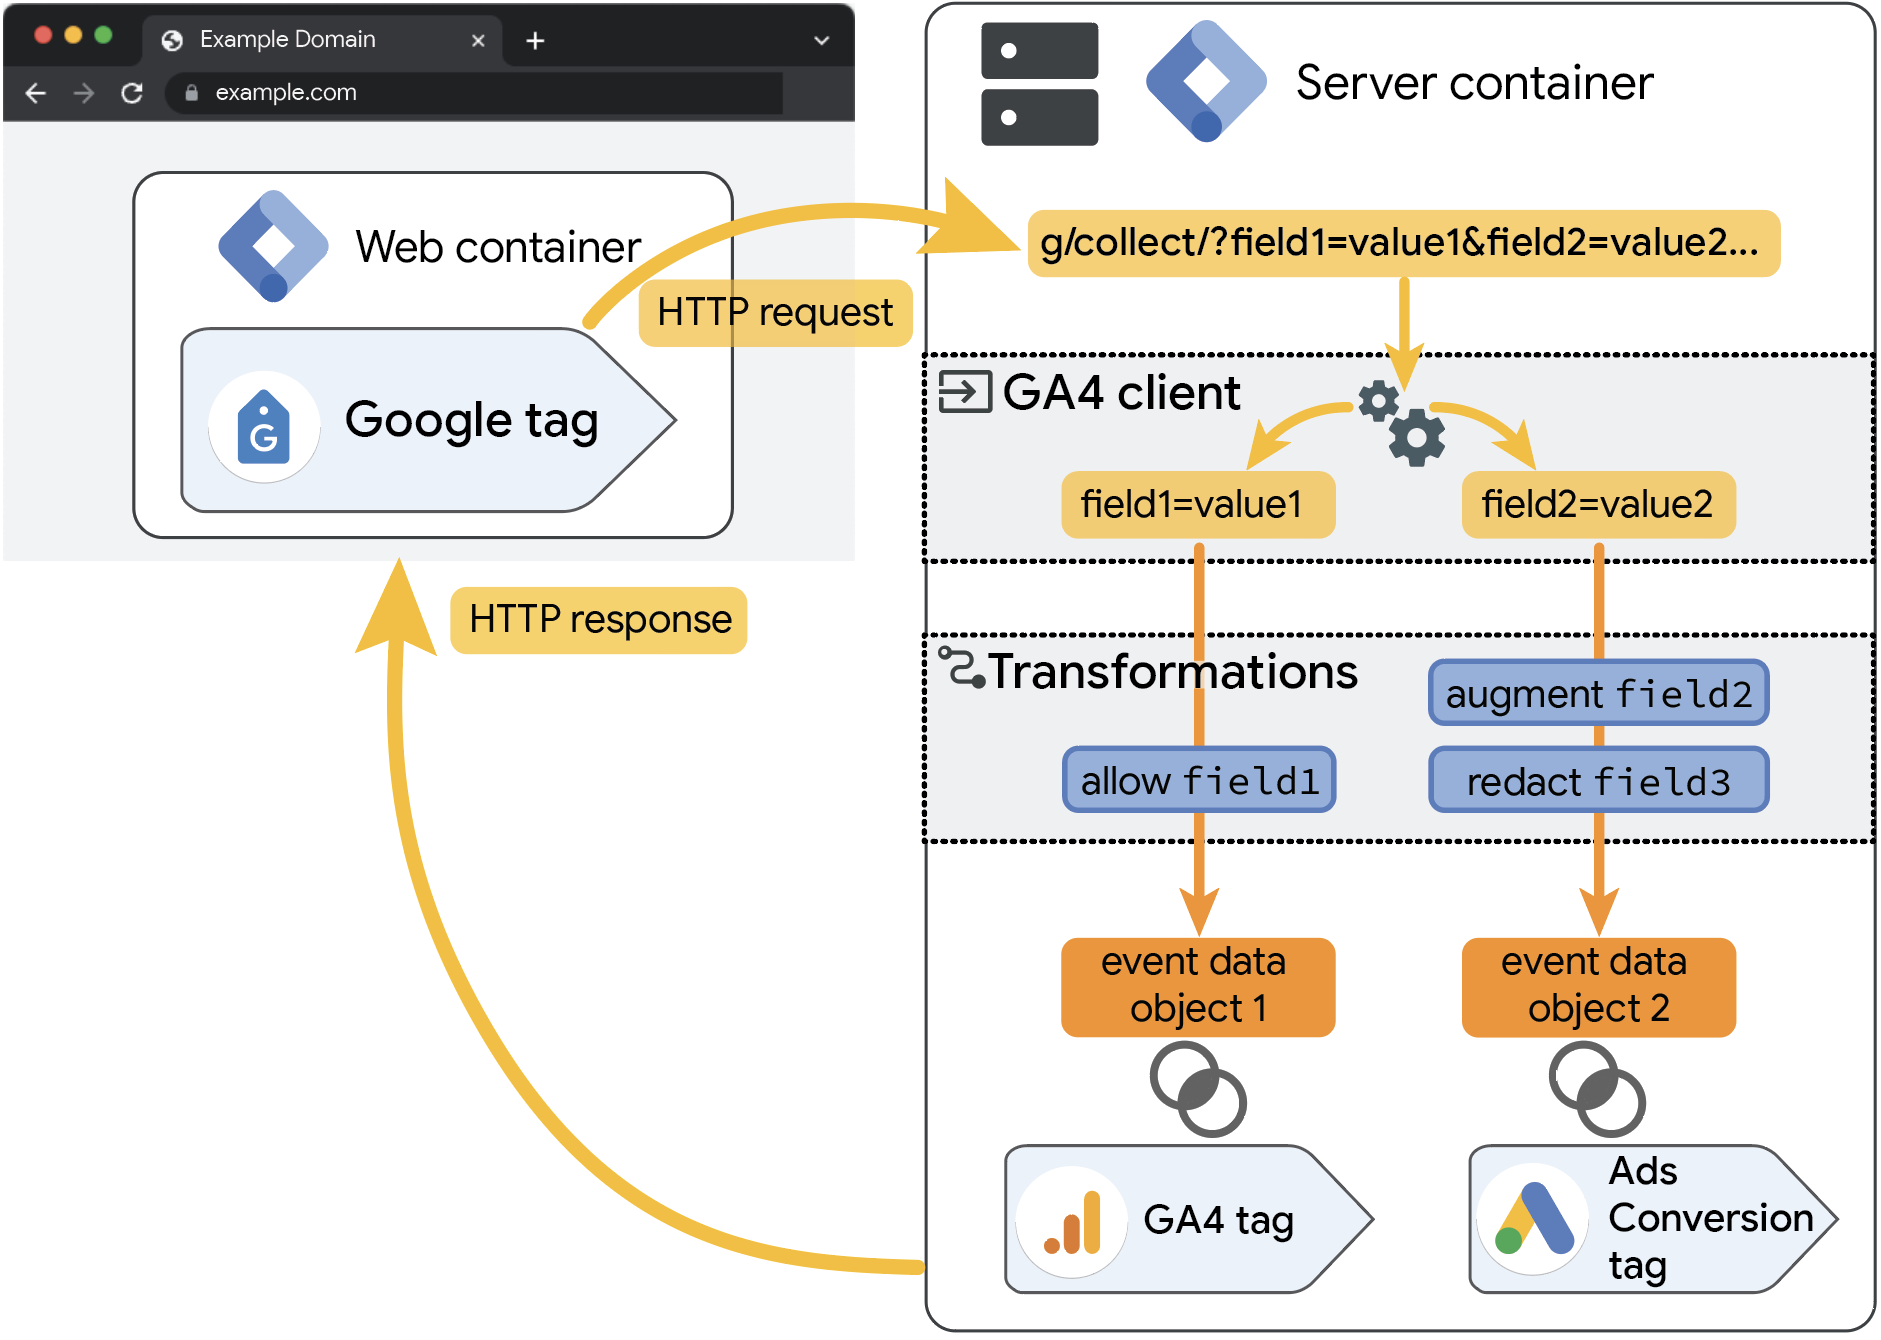
Image source: Google for Developers
THE OPERATOR'S CLOSE
Price the Customer, Not the Click
The most important number in a social advertising report may be the one it cannot supply: your own incremental profit per acquired customer. The Metricool benchmarks show where costs and campaign choices are moving. They do not choose the right channel for a specific store. Better decisions begin when creative testing, product economics and first-party measurement sit on the same scorecard—and when a cheap click has to earn its place in the margin calculation.
The Beecommercer Team