
Last updated on October 15, 2026 at 2:12 PM
Information current as of October 15, 2026. The periods covered by historical traffic, search data and customer reviews are noted separately.
JuJuBit connects AI-assisted design with personalized physical products that customers can buy. Starting with a photo, character or gift idea, users create designs online and can then have them made into figurines and other products. Scenario-based templates and social distribution help attract attention, while public reviews raise another question: do digital previews, finished products and delivery promises align?
JuJuBit’s website experience, third-party traffic estimates, public social accounts and customer reviews show how the business connects customer needs, online creation, purchasing and fulfillment. The useful lessons lie in how these stages work together, not in unverified revenue or advertising claims. Actual business performance still requires order and financial data.
Lead with a use case, not the technology
JuJuBit organizes entry points around photo figurines, tabletop gaming characters, couples and pets. Customers first choose what they want to create and a style, then enter the customization process. This turns abstract modeling capabilities into a more understandable shopping task. (View source: JuJuBit)
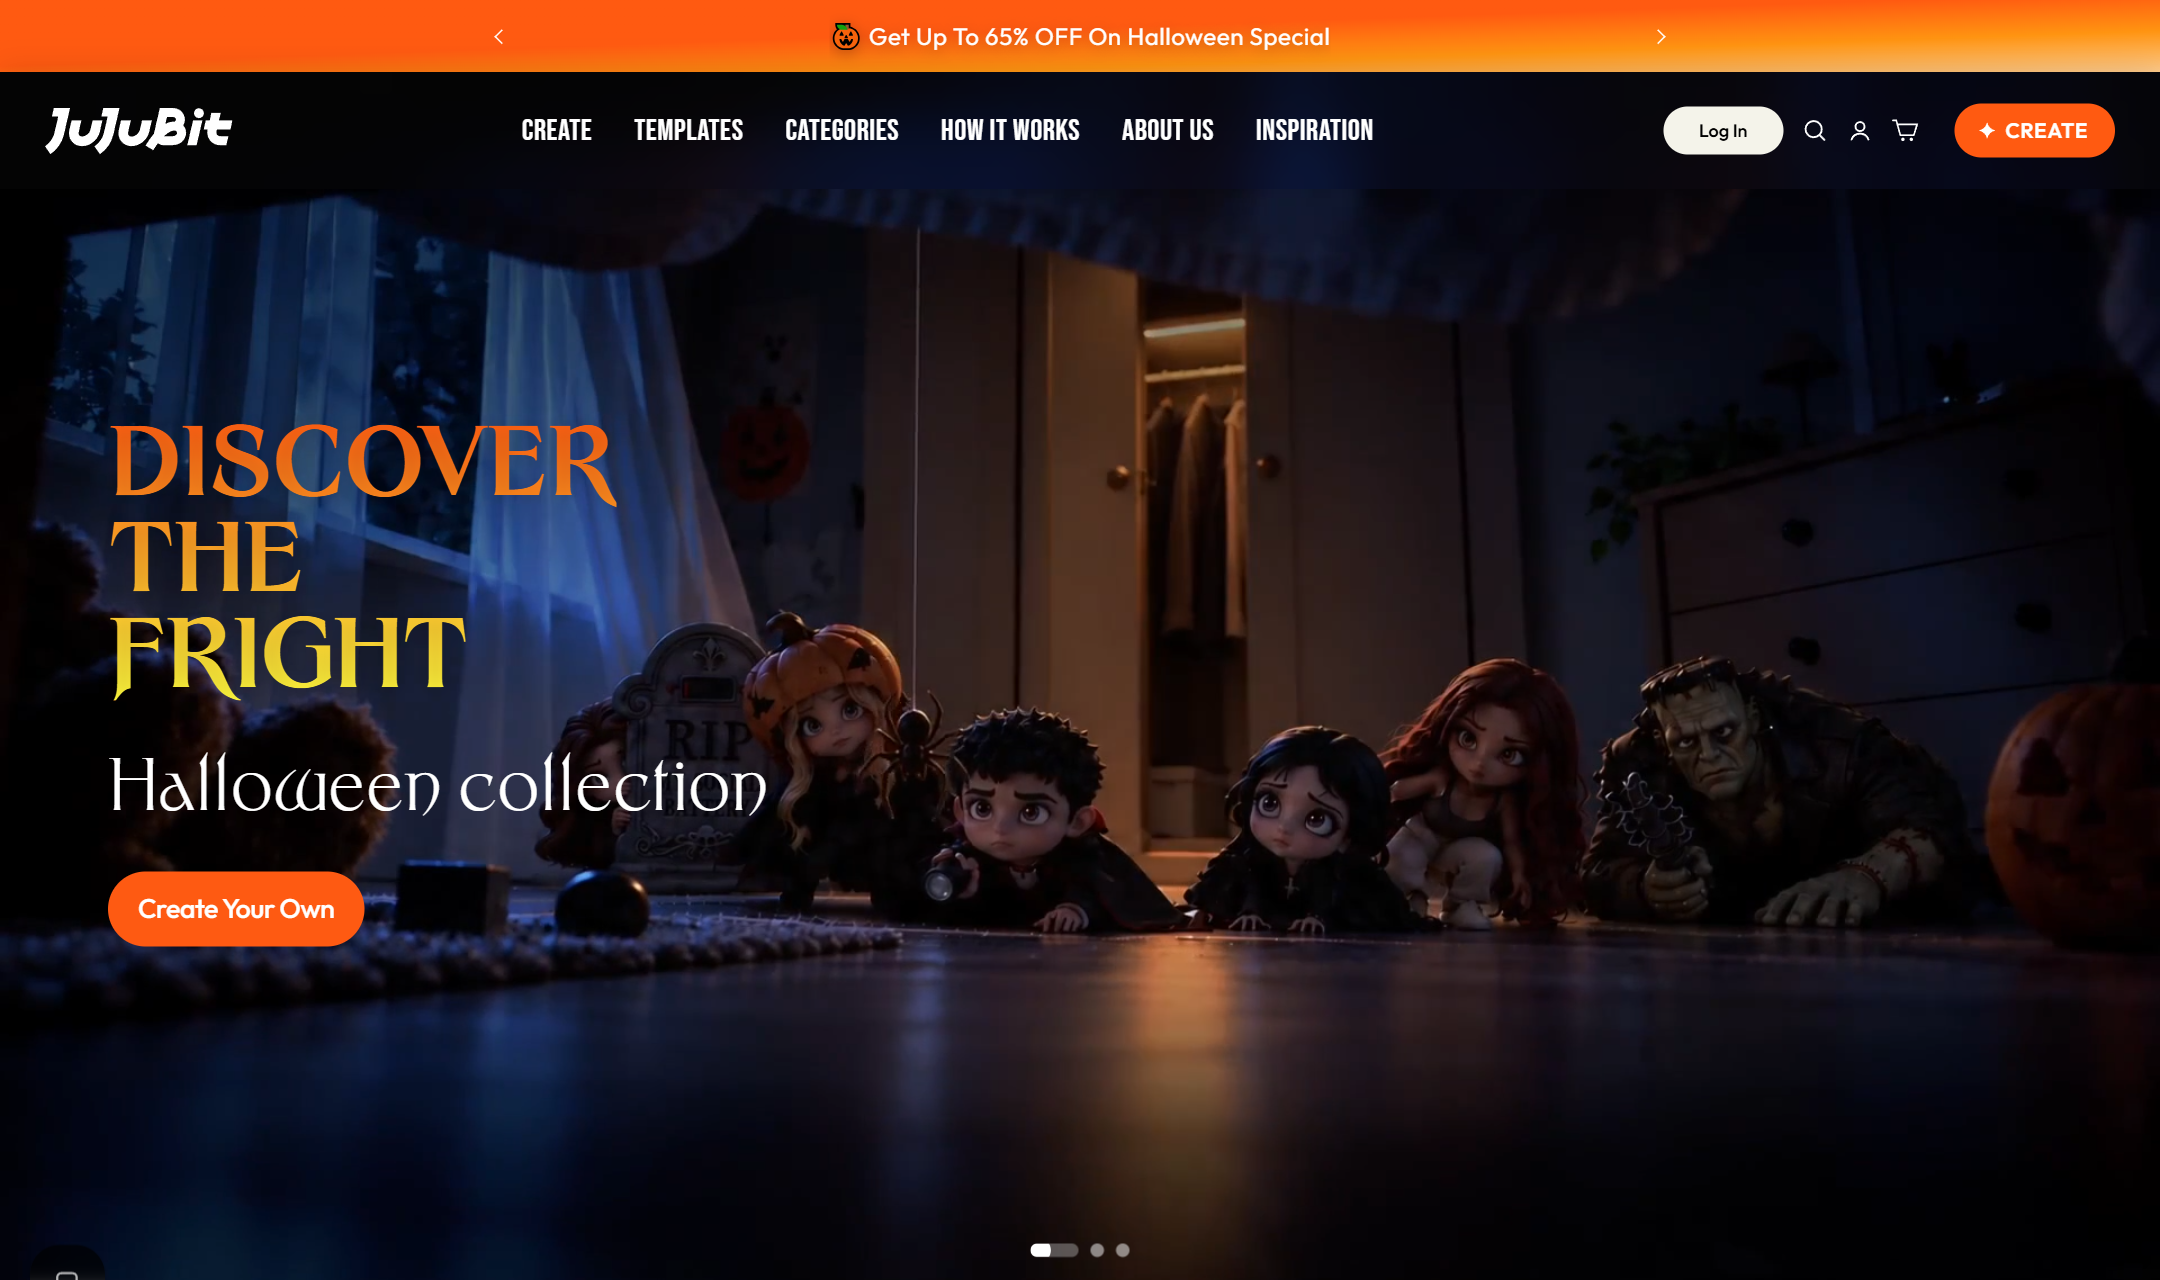
The homepage’s Halloween theme and promotional entry points give creative assets and product selection a shared focus, while helping visitors quickly visualize possible finished styles. The layout alone, however, does not establish how many historical visits or orders seasonal marketing generated; attribution data would be needed.
Bring customization steps and the creation interface together
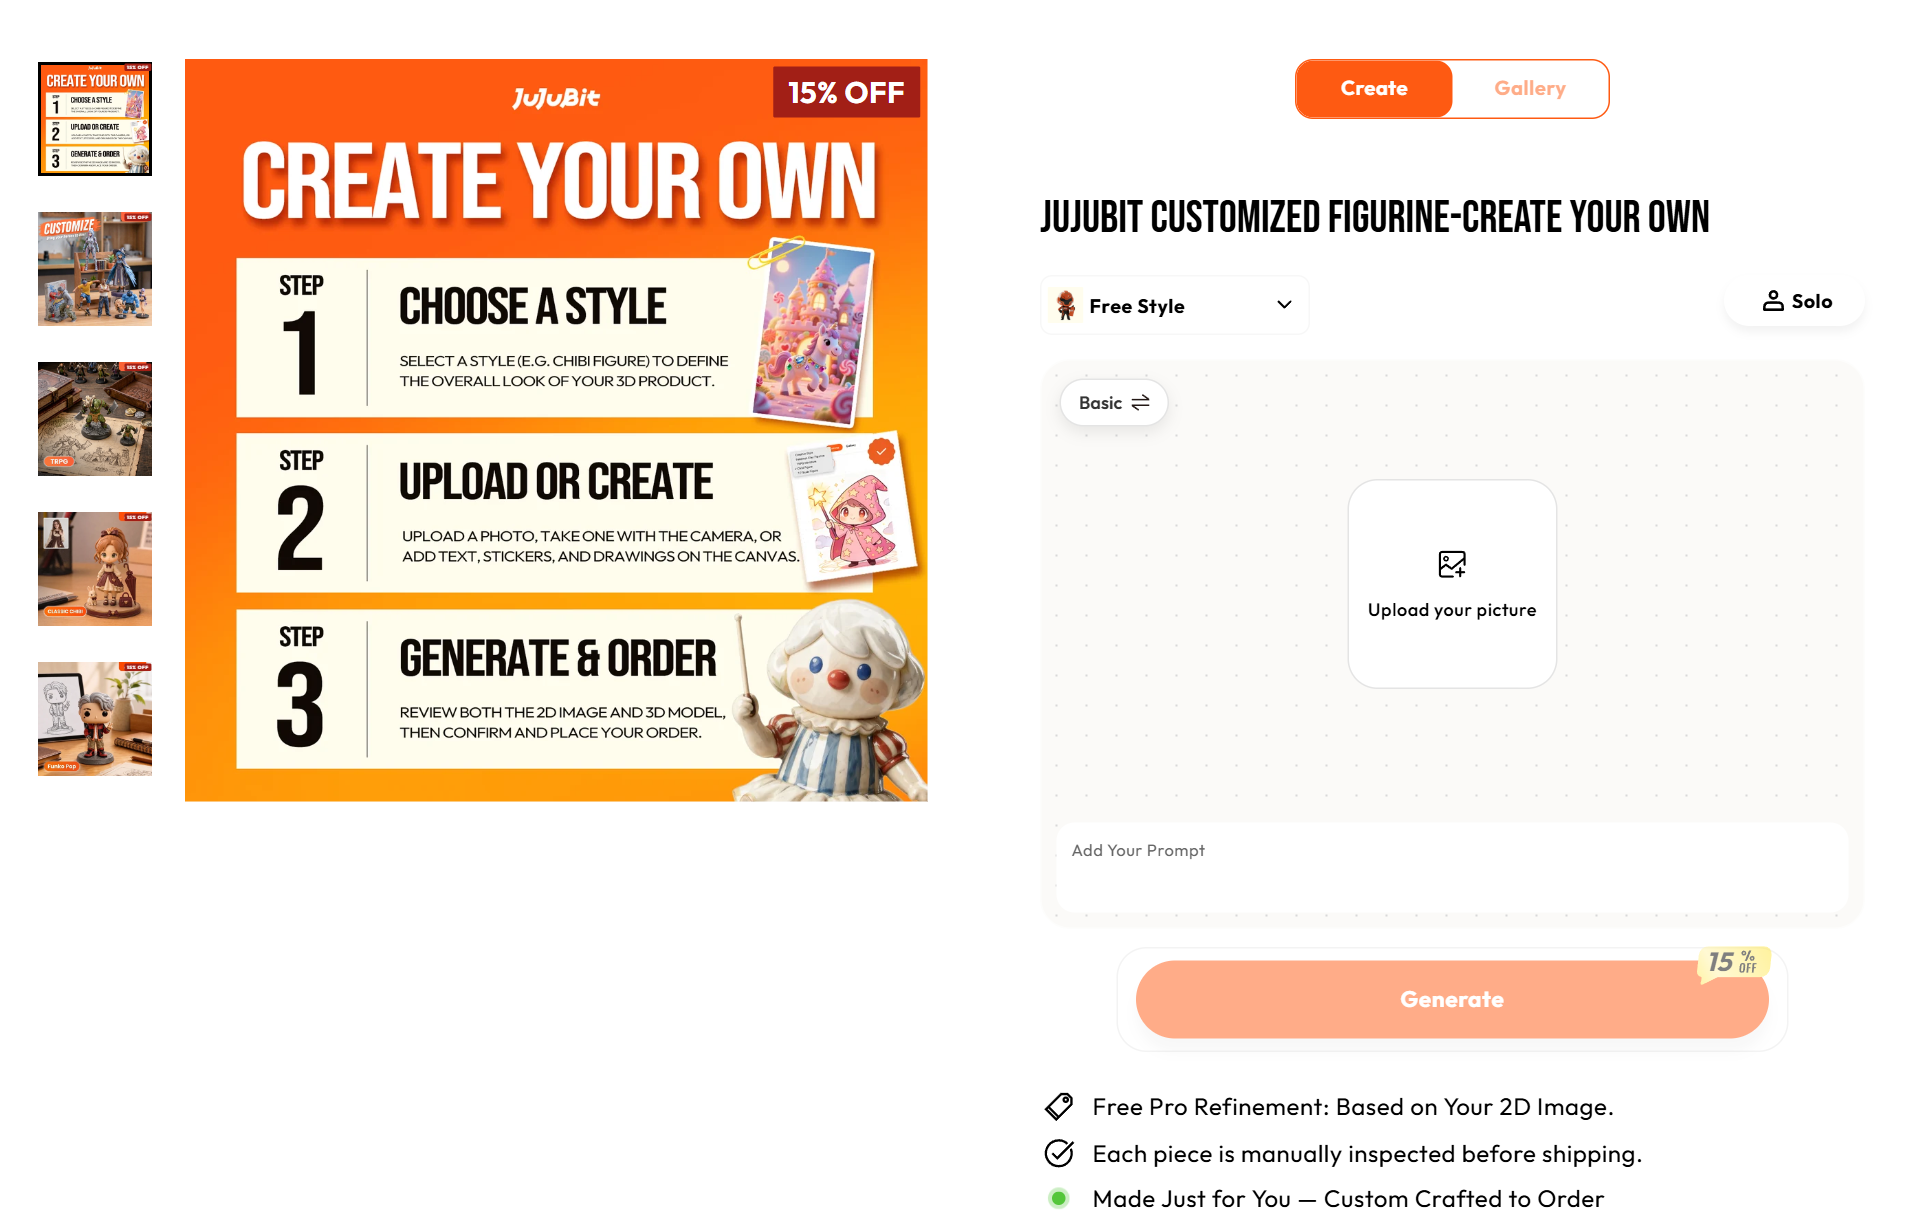
The customization page places style selection, image upload, additional prompts and the generation button in one interface. Users take part in creation before deciding whether to buy, making the website both a product showcase and a design tool. The official production process also places manual refinement, manufacturing and shipping after the digital preview. (View source: JuJuBit · Create Your Own · JuJuBit · How It Works)
| Website feature | Purpose | Outcome to verify |
|---|---|---|
| Style and use-case templates | Help users start creating without facing a blank input field | Customization starts and payment performance by use case |
| Generation and upgrade entry points | Connect design participation with more advanced experiences | Upgrade usage, production costs and order contribution |
| First-order discount and email signup | Give visitors a reason to buy for the first time or return | Actual subscriptions, return visits and first-order net revenue |
The website offers 15% off the first order through a popup, along with free standard shipping on orders over US$99. These practices address both first purchases and basket composition, but displaying an offer does not prove that conversion improved. Generation, customization starts and offer redemption should be tracked separately so that design participation is not mistaken for purchase intent. (View source: JuJuBit · Create Your Own)
The product description also states that production typically takes 8–12 business days and standard shipping typically takes 7–12 days; the selected size refers to the longest side of the finished item. Presenting price, specifications, dimensions and delivery timing together earlier can help reduce gaps between preview and physical product. These timings are website promises, not statistics on actual order delivery; prices and offers may also vary by specification and promotion. (View source: JuJuBit · Create Your Own)
Meaningful traffic, with a longer-term mix weighted toward paid channels
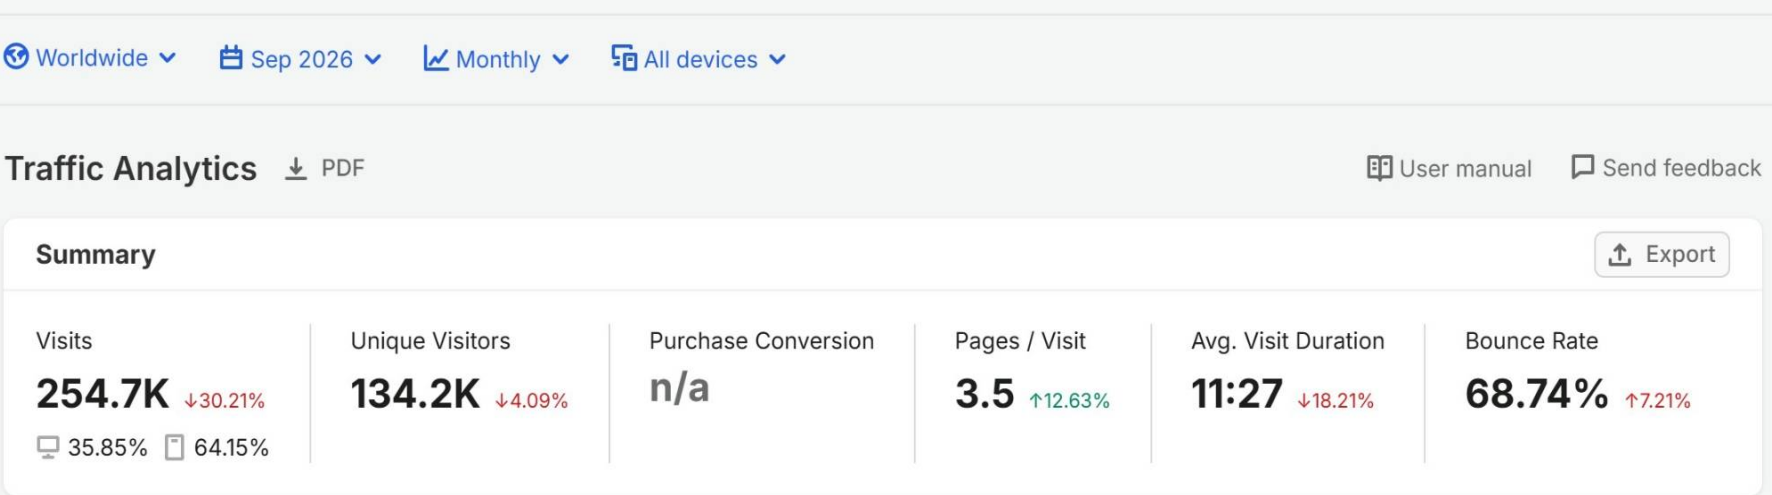
Semrush estimates that JuJuBit received 254,700 visits and 134,200 unique visitors in September 2026, with visits down 30.21% from August. Similarweb’s longer-term curve also shows a substantial increase in mid-2026 followed by a September pullback, but of a different magnitude. This indicates volatility; the two models should not be combined into a precise month-by-month growth series.
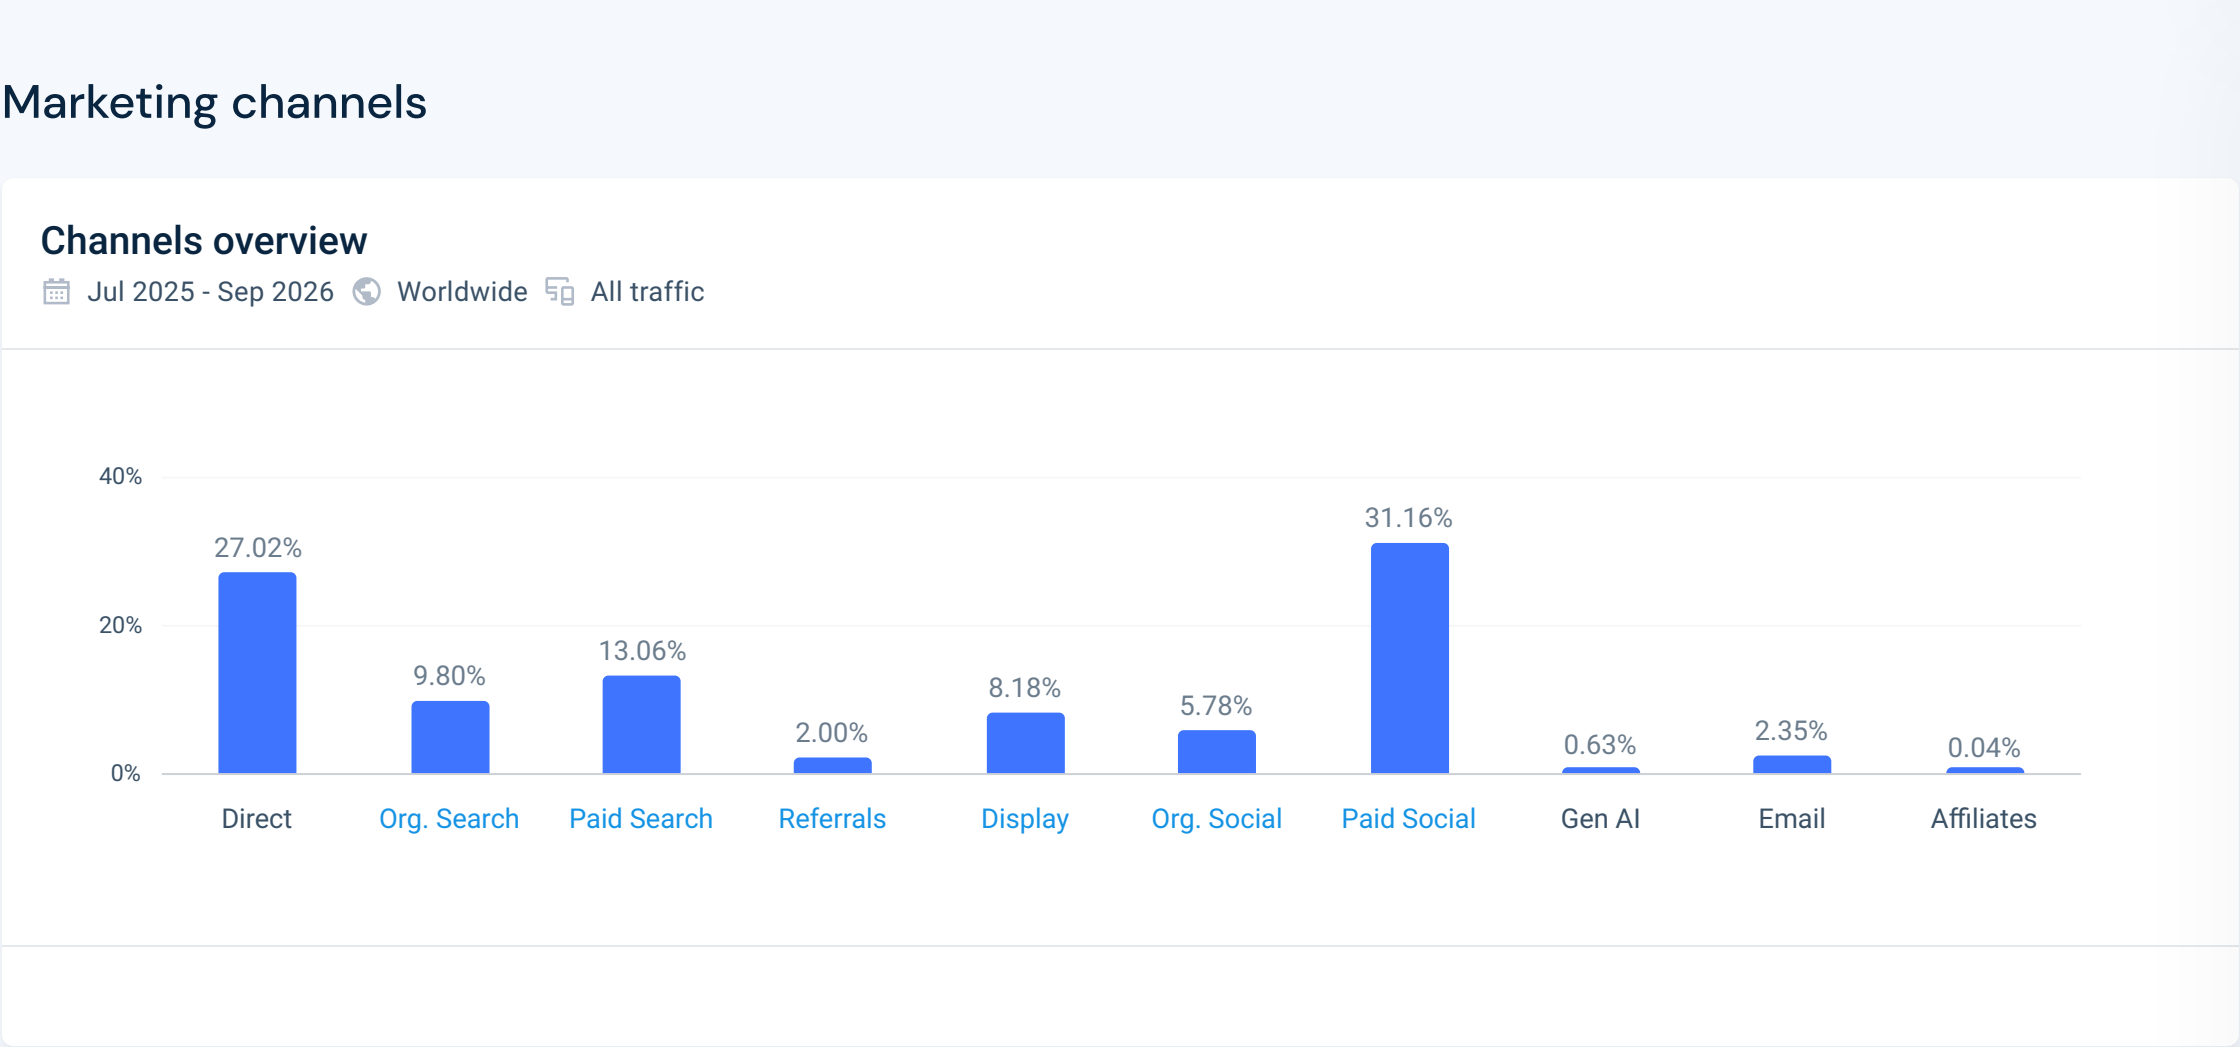
In Similarweb’s channel breakdown for July 2025 through September 2026, paid social accounts for 31.16%, paid search for 13.06% and display advertising for 8.18%—a combined 52.40%. Organic search accounts for 9.80%. These figures describe traffic sources, not the breakdown of advertising spend, orders or revenue, and cannot be applied directly to any individual month.
Semrush’s September data also shows that the United States accounts for 68.91% of visits, mobile accounts for 64.15% of sitewide visits, and the two main custom product pages have a combined displayed page-traffic share of 47.50%. The US mobile experience and core customization pages are therefore more focused starting points for optimization than a uniform sitewide overhaul. These page shares must not be added up as unique users or orders.
Semrush’s purchase conversion rate field is n/a. The available traffic data is insufficient to verify revenue, customer acquisition cost, advertising return or repeat-purchase performance.
Concentrated social traffic does not mean owned accounts are mature
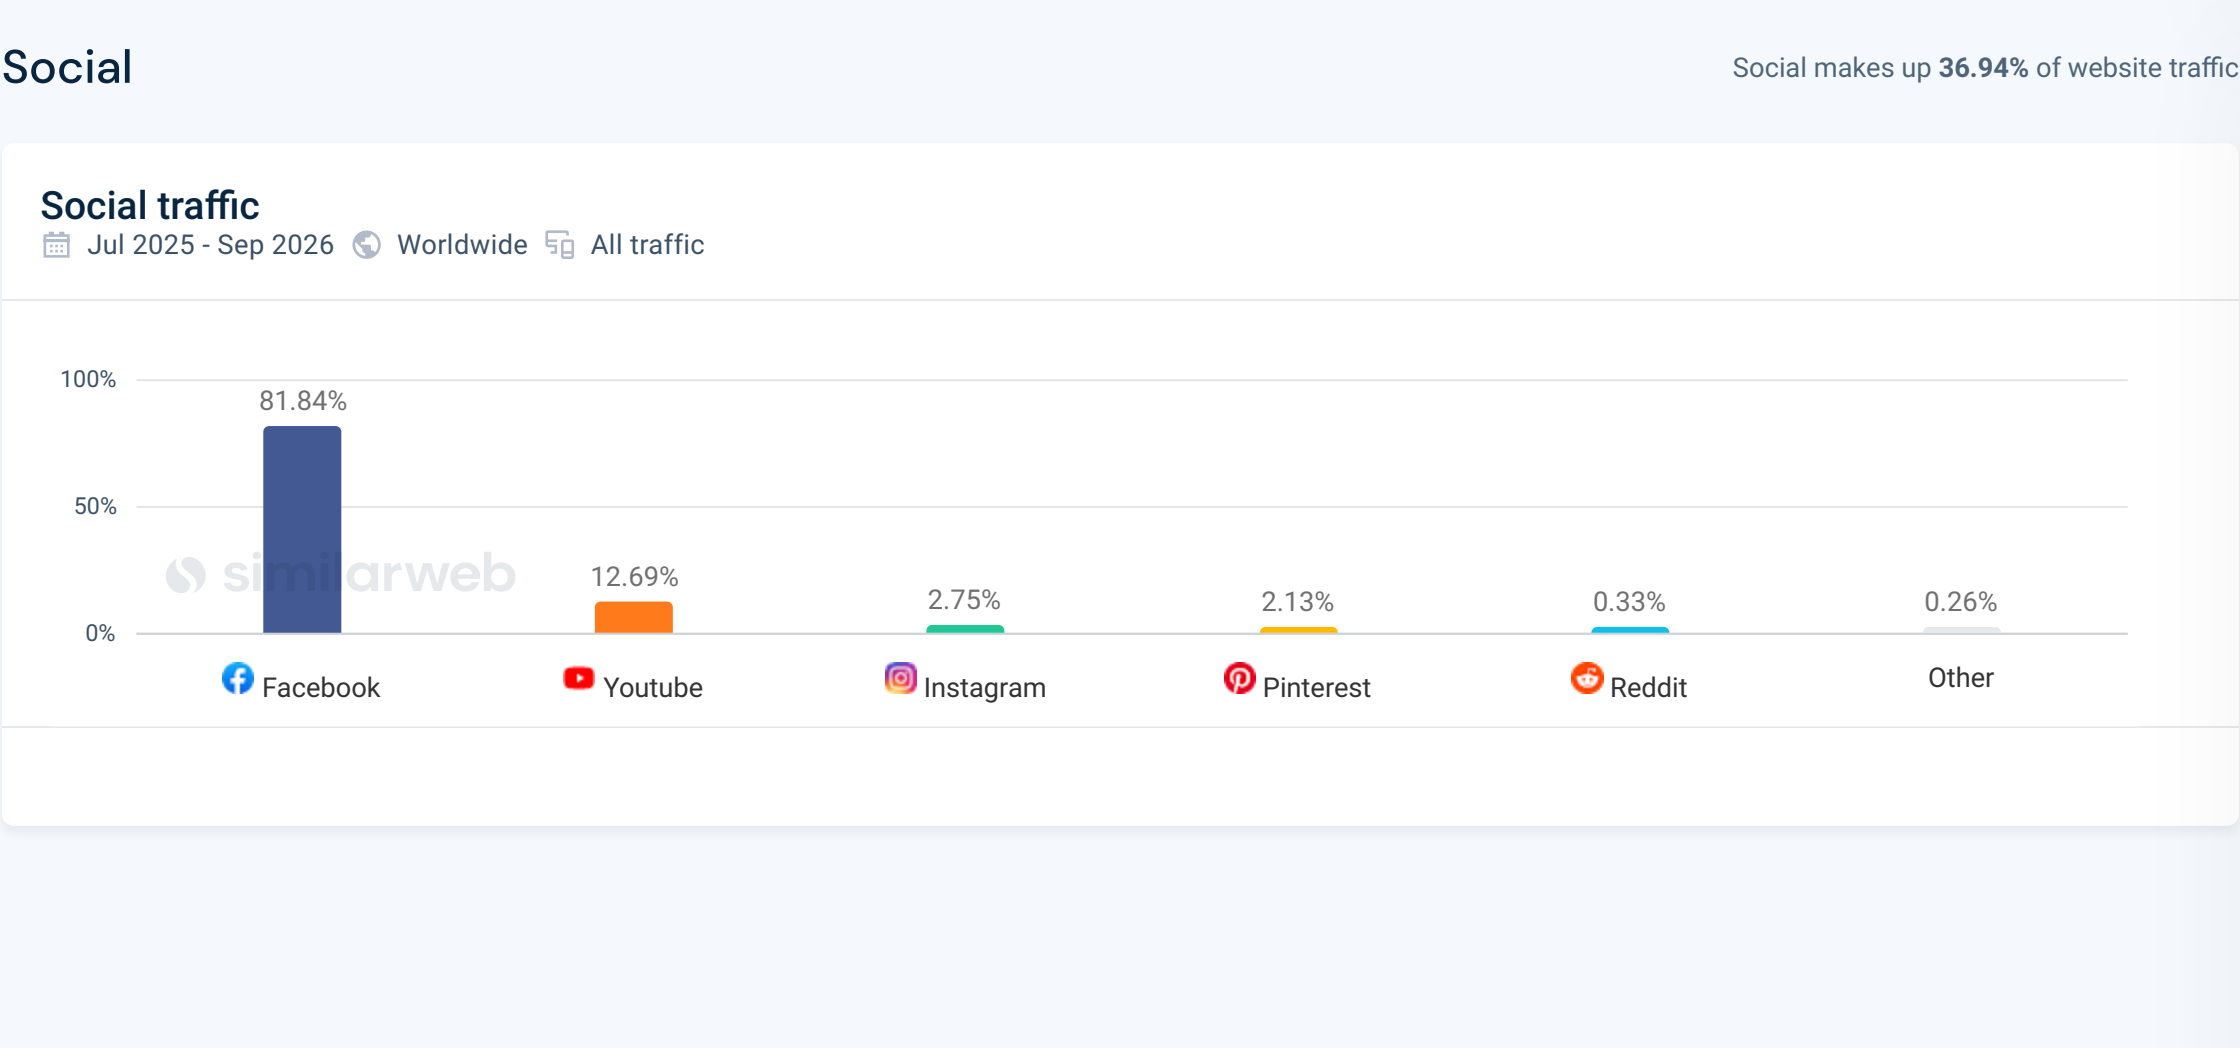
Similarweb attributes 31.16% of total site traffic to paid social and 5.78% to organic social, totaling 36.94%. Within social traffic, Facebook accounts for 81.84% and YouTube for 12.69%, together reaching 94.53%. This is a highly concentrated platform mix, but these shares include platform-related referrals and cannot all be attributed to the brand’s own accounts.
| Platform | Account confirmed by the official website | Account size | Additional information |
|---|---|---|---|
| @thisisjujubit_ | 5,744 followers | Following 81 accounts | |
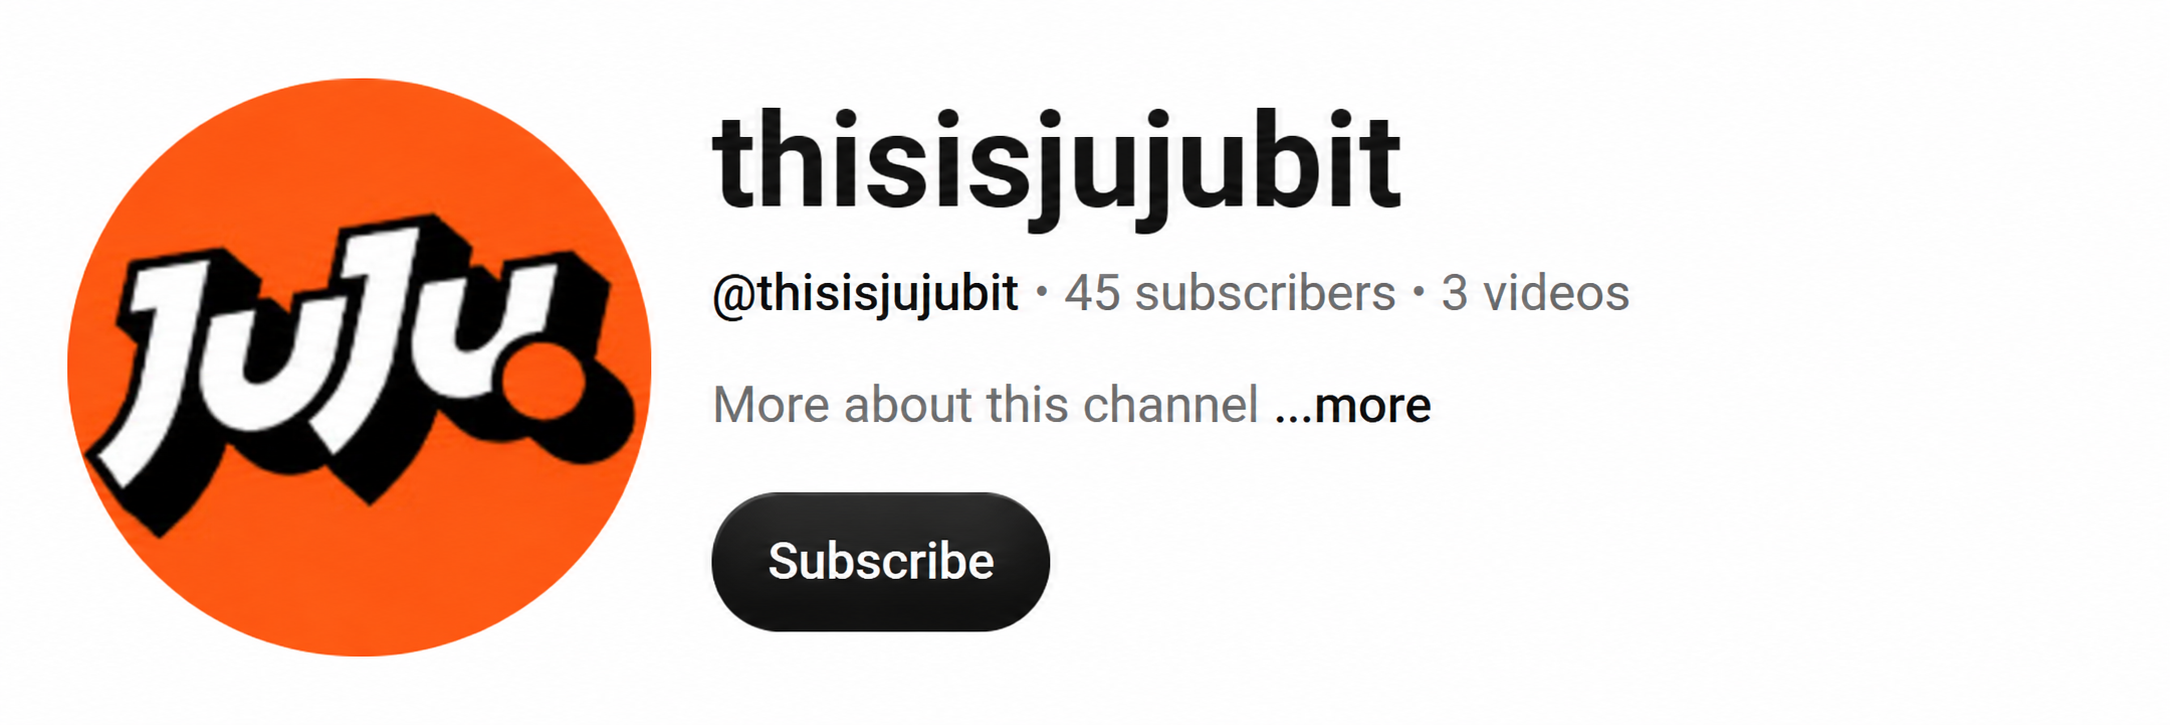
| YouTube | @thisisjujubit | 45 subscribers | 3 videos |
| TikTok | @jujubit_official | 437 followers | 877 total likes |
Account figures come from public pages viewed on October 15, 2026. Their timing and scope differ from those of historical referral shares. They should not be summed into a deduplicated audience or used to calculate acquisition efficiency per follower or engagement rates. (View source: Instagram · @thisisjujubit_ · YouTube · @thisisjujubit · TikTok · @jujubit_official)
Facebook’s high share of incoming social traffic makes its related creative assets and purchase journeys a priority for review. A verifiable audience figure for the official Facebook page is unavailable, however, so a further comparison is not possible. Instagram’s 5,744 followers likewise cannot explain all social contribution: impressions, engagement, outbound clicks and completed purchases need to be verified separately.
Similarly, the official YouTube channel’s 45 subscribers cannot explain the platform’s entire 12.69% share of social referrals. Creator content, search discovery and other referrals are potential sources requiring further investigation; the two datasets also differ in timing and scope.
The creator program brings physical product experience into distribution
JuJuBit’s public creator program offers a 5% commission and prioritizes recruitment on TikTok, Instagram and YouTube. The process includes screening and matching, product samples, content creation, and dedicated discount codes and UTM links. Its value lies in bringing hands-on product experience into content distribution while creating a way to track subsequent sales. (View source: JuJuBit · Join Us)
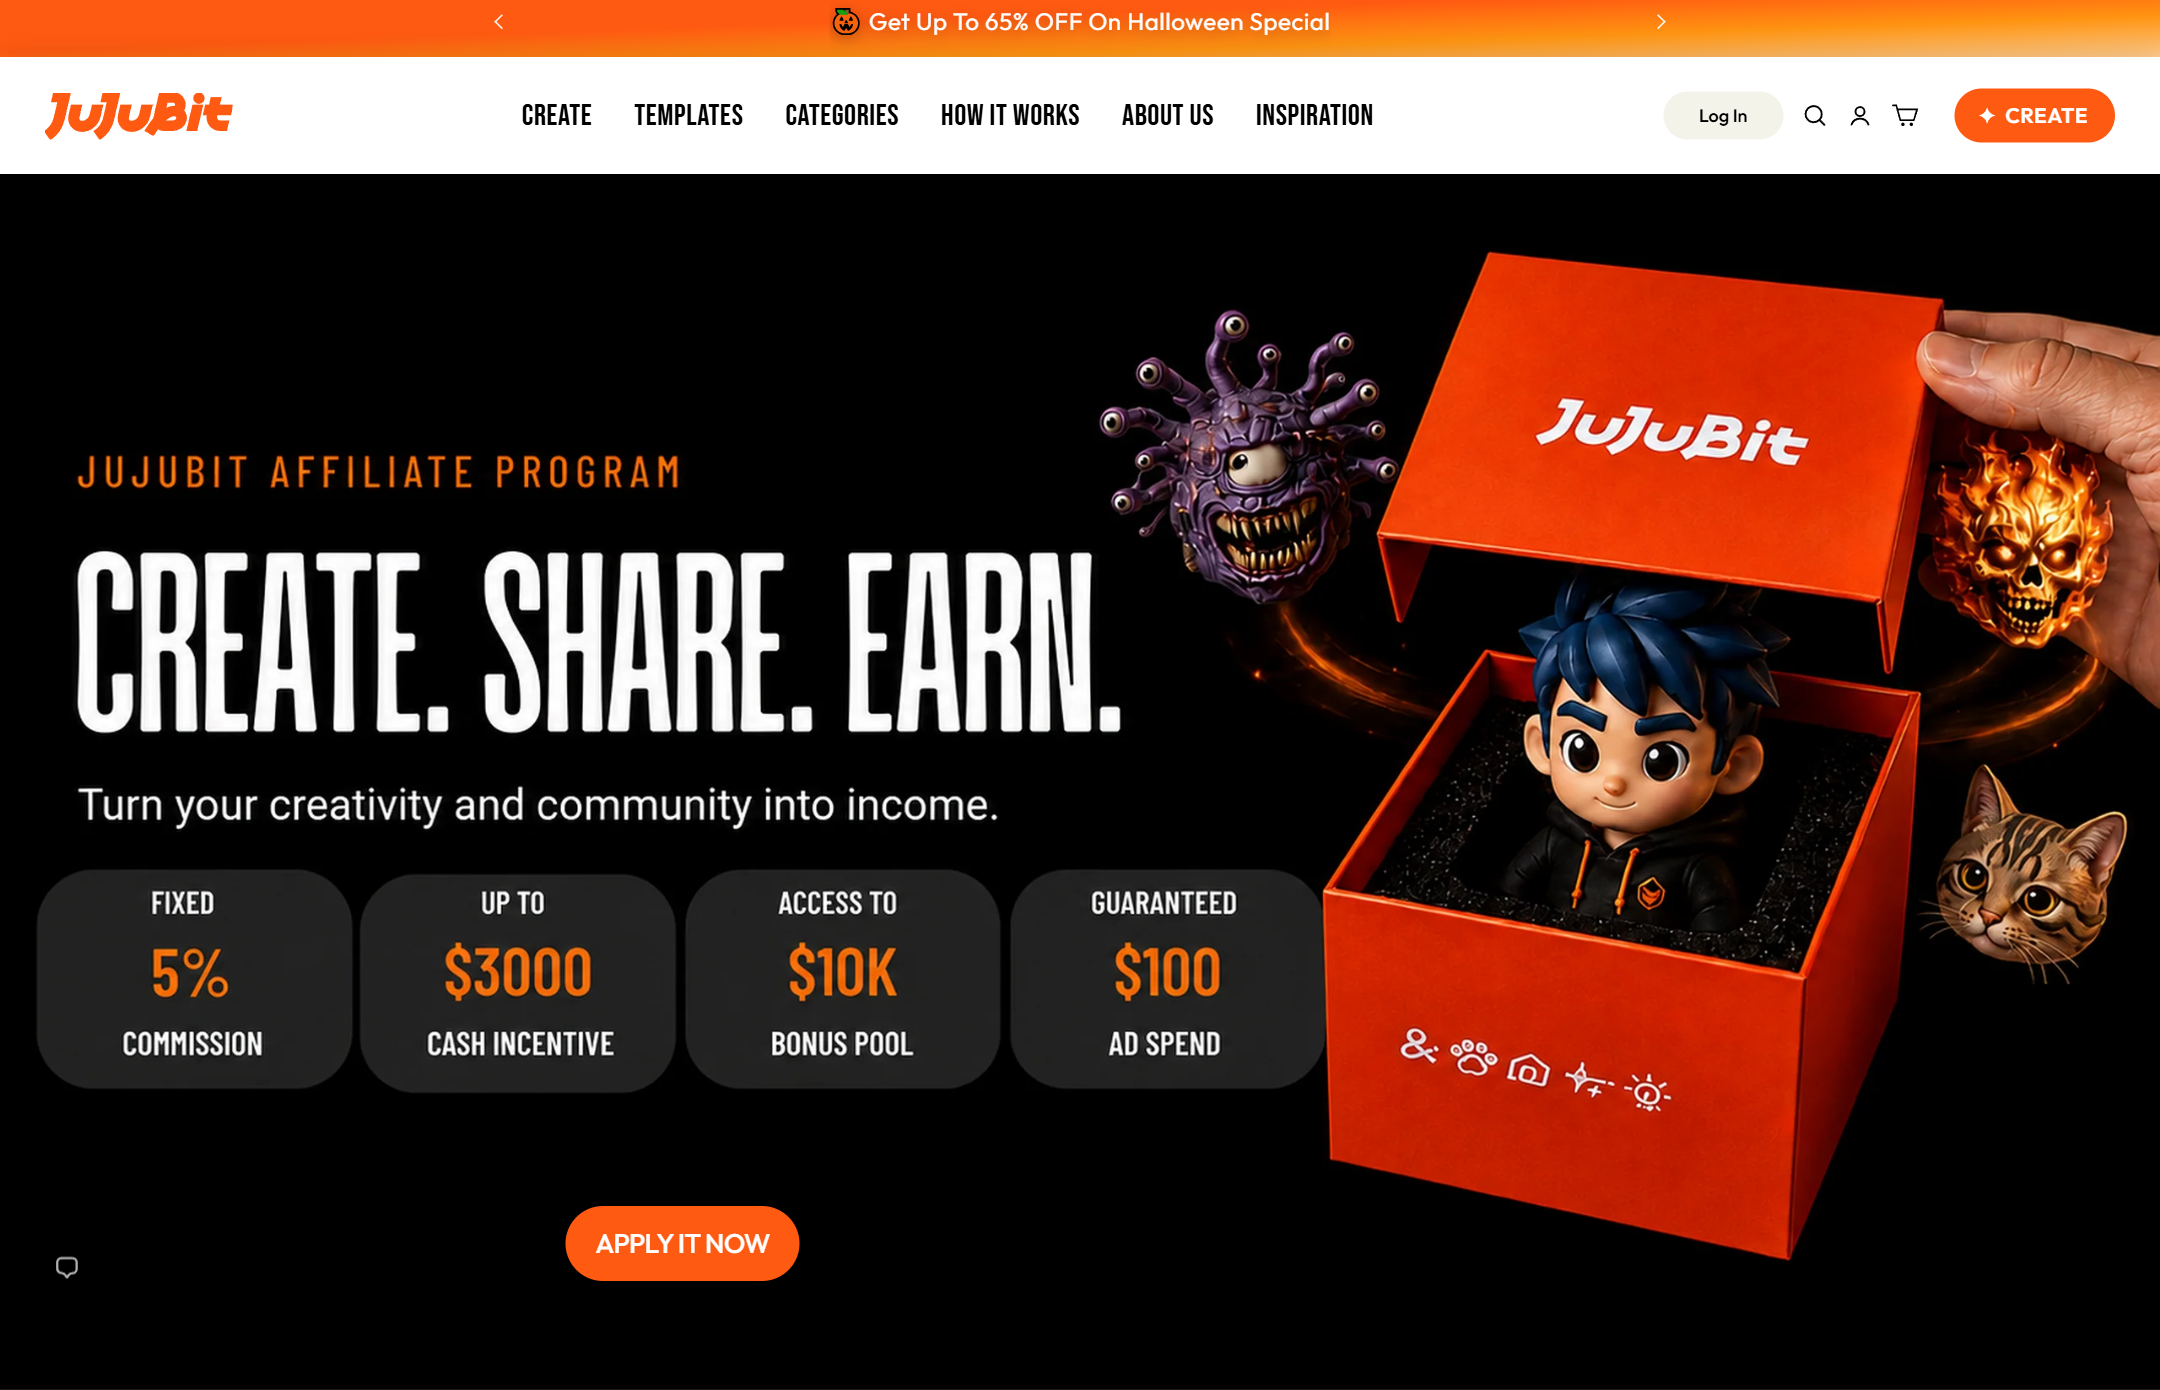
Public pages for Tiffany and Brendan and marmara.setup display dedicated JuJuBit referral links or discount entry points, with content focused on couples’ lifestyles and desktop technology. This confirms that public referral routes exist, but not that content has been published on every platform. It also does not establish the number of partnerships, reach or orders. (View source: Tiffany and Brendan · marmara.setup)
One photo-to-figurine video on the official YouTube channel shows 164 views and runs for 1 minute 22 seconds. It is a single sample, not a measure of average channel views or sales performance. Instagram content also addresses production progress and design rights, showing that the account helps explain product promises. (View source: YouTube · @thisisjujubit · Instagram · @thisisjujubit_)
A stronger recurring content format would compare the reference image, digital preview and physical result for the same piece, clearly showing dimensions and the production process. Content evaluation should track valid orders, refunds and production costs—not just followers and views.
Search and AI visibility: reaching demand beyond branded queries
On October 13, 2026, Semrush’s US desktop dataset showed approximately 2.4K organic traffic and 187 organic keywords. The top five organic keywords were all the brand name or its variants, with displayed traffic shares totaling 95.93%. Similarweb’s September organic search breakdown was 81% branded and 19% non-branded. The denominators differ, but both suggest that search primarily captures existing brand awareness.

Non-branded content could address custom photo figurines, tabletop character models and personalized gifts, but it should answer purchasing questions rather than merely expand keyword coverage. Clear information on actual size, bases, colors, detail and lead times can connect intent-focused pages to customization while responding to questions raised on social media and in reviews.
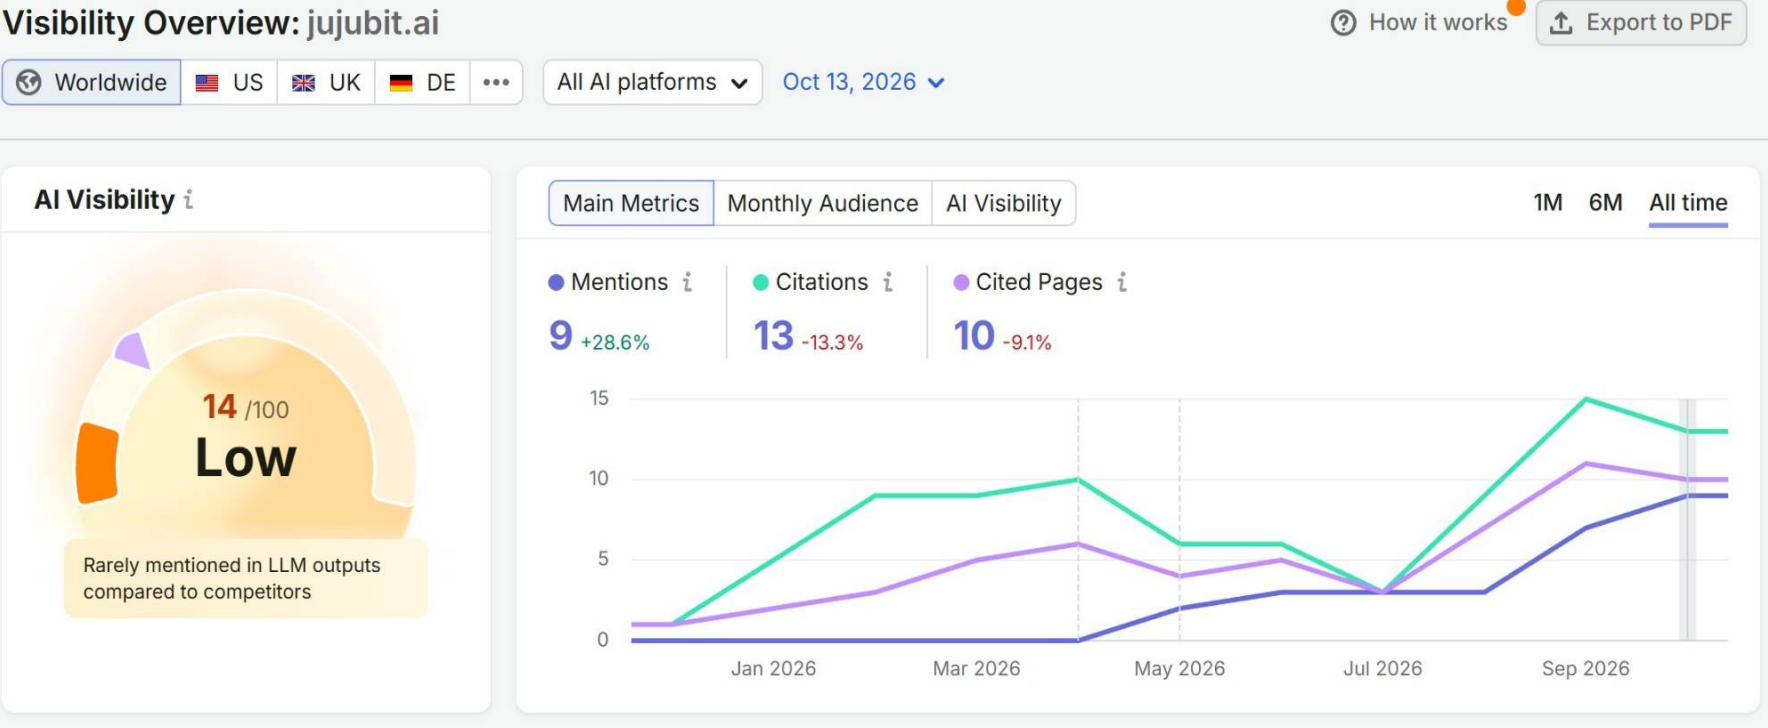
This view shows an AI visibility score of 14/100, with 9 brand mentions, 13 citations and 10 cited pages—a limited dataset. Topics such as D&D miniatures and AI-generated figurines are relevant to the products, and a fixed set of prompts could track citation changes. The tool’s opportunity counts and AI Volume must not be interpreted as the number of users this website could acquire.
Search database estimates are not equivalent to all-device site visits, and AI mentions are not visits or revenue. Non-branded visibility, customization starts and actual purchases should be verified separately.
Trustpilot: appreciation for the product alongside fulfillment concerns
As of October 15, 2026, JuJuBit’s displayed Trustpilot rating was 3.6, based on 140 reviews. The overall distribution includes a substantial number of positive reviews as well as notable low-star feedback. Understanding reputation requires looking at the overall mix, recent review samples and specific issues—not just quoting an average score. (View source: Trustpilot)

| 5 stars | 4 stars | 3 stars | 2 stars | 1 star |
|---|---|---|---|---|
| 48% | 17% | 9% | 3% | 23% |
The recent sample mainly discusses waiting and order progress
In a sample of 10 consecutive reviews from Trustpilot’s Most recent list, 8 were 1-star, 1 was 2-star and 1 was 4-star. Eight mentioned waiting, unclear order progress or not receiving all items. This set includes updated reviews and is not a random sample; these proportions must not be treated as complaint rates across all customers.
| Review theme | Reviews mentioning it | Interpretation limits |
|---|---|---|
| Waiting, unclear progress or incomplete delivery | 8 / 10 | User accounts; not evidence that all orders are overdue |
| Of these, explicitly mentioning missing items | 2 / 10 | A subset of the preceding theme |
| Finished-product detail or fragility | 2 / 10 | Themes may overlap and cannot be added into a customer percentage |
A separate set of 6 positive and mixed reviews includes praise for the likeness of finished products, ease of use and customer service remedies. These comparison reviews are not included in the frequencies above. Operationally, the priority is to check delivery stages, order completeness and communication status, while using physical-product explanations to reduce discrepancies in detail and size. A negative-review response rate is not a substitute for an issue-resolution rate. (View source: Trustpilot)
The sample excludes the AI summary recommendation box at the top. Transactions and subsequent resolutions were not verified order by order, and no conclusions about company motives are drawn.
Google Play: distinguish app experience from physical-product reputation
The Google Play app reliably associated with JuJuBit is JuJuBit: AI Custom 3D Figures. Its developer is listed as Tripo AI, and its support and privacy pages link to jujubit.ai. In the original screenshot dated October 15, 2026, the top of the listing showed a 4.4 rating, 435 reviews and a 10K+ download tier. These are app-platform metrics: downloads are not orders, and an app rating does not represent satisfaction among all physical-product buyers. (View source: Google Play)

| Review date | Issues mentioned by the reviewer | Operational implication |
|---|---|---|
| September 1, 2026 | Generated detail, difficulty making revisions and file export restrictions | Explain editing capabilities and file rights before creation begins |
| July 12, 2026 | Pricing, size information before purchase and handling failed generations | Show prices, specifications and failure-handling policies earlier |
| July 10, 2026 | Appreciation of the concept and interface, alongside concern over per-model pricing | Distinguish collectible gifts from bulk use in tabletop gaming |
These are the 3 reviews displayed by default on Google Play, selected by the platform rather than a consecutive recent sample. They are not used to calculate positive or negative proportions or infer individual star ratings.
Users may enjoy the design process yet remain uncertain about dimensions, prices or physical results. A higher app rating does not remove risks in production and shipping. A more useful approach is to examine generation, revision, ordering and fulfillment separately, rather than combine all feedback into one satisfaction score.
The connection between JuJuBit and the business profiles behind Google Maps reviews or Google Customer Reviews cannot be confirmed, so those ratings are not included. Google Play, Trustpilot and on-site reviews concern different subjects and audiences. They should be presented separately with platform names and dates, not combined into an overall online positive-review rate.
Reddit: purchase trust comes back to evidence of products and delivery
Across a sample of 8 Reddit posts from 7 communities, 5 opening posts ask questions before purchase. The idea attracts users first; they then seek evidence of actual delivery, size and quality. These posts reveal specific buying questions, not the distribution of sentiment across the internet. (View source: r/tabletopgamedesign · r/FDMminiatures · r/AllThingsDND · r/DnDminiatures · r/animeGK)
| Purpose of the opening post | Sample count | How to interpret it |
|---|---|---|
| Pre-purchase question | 5 | These posts seek evidence of trustworthiness and product experience |
| User-reported review | 1 | One person’s physical-product comparison does not represent overall satisfaction |
| Creation showcase with a brand link | 1 | Partnership status is unknown; not classified as an organic recommendation |
| Third-party scanning tool report | 1 | Not a purchase experience and not counted as a buyer complaint |
Relevant comments include praise for likeness and expressions of willingness to buy again, alongside concerns that colors are paler than the preview, details are lacking or slender parts are thicker. Tabletop gamers also discuss the difference between 35 mm and 40 mm, and whether bases and models fit alongside other pieces on the table. Suitability for the intended use is closer to the real buying decision than the mere ability to generate a model. (View source: r/FDMminiatures · r/AllThingsDND)
Feedback on lead times and customer support is also inconsistent. Some users describe receiving orders and service remedies, while others report waiting or difficulty making contact. These are all user accounts that have not been verified order by order; willingness to buy again is not evidence of a completed repeat purchase. (View source: r/AllThingsDND)
The sample of 13 relevant comments involves 10 accounts and does not include every comment in the threads. An account may repeat an experience across posts, and the same set of product photos has been referenced more than once. One user also disclosed receiving a discount code after leaving a review. Repeated posts, images or content with an incentive cannot be counted separately as organic recommendations from multiple independent buyers.
The clearest website takeaway is to show the original image, preview and physical result with a ruler for the same piece, while explaining limitations around small sizes, color, fine or pointed parts and delivery. These assets can support product pages, creator videos, FAQs and search entry points, but any actual improvement still needs to be tested against sales and after-sales data.
The Reddit sample covers material available through October 15, 2026 and is neither random nor exhaustive; no overall positive-review rate is calculated. Total comment counts and upvotes lack data from a consistent collection date, and missing values are not treated as zero. Showcase and scanning-tool posts are used only to distinguish sample types. (View source: r/Talisman · r/ScamChecker)
Operational lessons: align the creative experience with delivery promises
JuJuBit connects personalized needs, online creation and physical products. Sustained growth also depends on whether that journey gives customers a clear understanding of price, finished results and lead times—and delivers on it after purchase. Acquisition potential and fulfillment capacity belong on the same operational checklist.
| Priority | Issue indicated by the evidence | Recommendation and verification focus |
|---|---|---|
| Audit fulfillment first | Recent reviews mention order progress and missing items | Check backlogs, promised lead times and complete delivery by order month, product and production stage—not just public responses |
| Clarify physical-product expectations | Size, color and detail recur in discussions | Show ruler-based product photos alongside previews on core product pages; track quality questions, rework and refund reasons |
| Expand search discovery | Organic search mainly captures existing brand awareness | Build intent-focused pages for photo figurines and tabletop role-playing games (TRPGs), tracking non-branded visibility, customization starts and sales separately |
| Improve distribution measurement | Channel shares and account sizes cover different scopes | Check valid orders, refunds and production costs by creative asset, creator and source before deciding whether to scale |
For DTC stores selling personalized products, use-case entry points help customers express a need, interactive tools encourage participation, physical-product content supports evaluation, and dedicated links preserve attribution signals. Each step should correspond to measurable behavior and cost so the business can determine whether growth creates sustainable value.
Public information is not yet sufficient to verify JuJuBit’s revenue, profit, customer acquisition costs or repeat-purchase performance. This case study therefore limits its conclusions to evidence-backed operating structures and improvement opportunities: expand demand discovery while making explanations of physical products and delivery as clear as the creation experience.
Sources and data notes
| Source | Scope used | Main limitation |
|---|---|---|
| Semrush | Visits: September 2026, worldwide, all devices; search: October 13, US desktop; AI: October 13, worldwide | Search database estimates, site visits and AI mentions are not combined |
| Similarweb | July 2025–September 2026, worldwide; branded search breakdown covers September 2026 only | The longer-term channel mix is not applied directly to individual months |
| Official website and social accounts | Page content and account data as of October 15, 2026 | Programs, promises and audience counts are not evidence of completed sales |
| Trustpilot, Google Play and Reddit | Platform data as of October 15, 2026 and review samples identified in the article | Reviews are user accounts; platform subjects and sample scopes differ |
Third-party traffic data helps explain channel structure and trends, but cannot replace order and financial records. Similarweb’s total visits, monthly visits field and headline period leave the effective number of months unclear, so no average monthly visits figure is calculated for the entire period. Pullback magnitudes and engagement metrics from different tools are not combined either.
52.40% is the sum of three paid-channel shares; 36.94% is the sum of two social-channel shares; and 94.53% is the combined Facebook and YouTube share within social traffic. The 47.50% figure sums the displayed shares of two product pages, while 95.93% sums the displayed shares of the top five branded keywords. Each calculation retains its own denominator.
Except for the interface text translated into English in Figure 7, screenshots retain their original display. The figures reflect the dates stated alongside each image, not real-time data. Ratings, follower counts, offers and page content may change.