
Last updated on November 20, 2026 at 10:17 AM
A customer searches for a household essential on a retailer’s app, sees a sponsored option, checks availability nearby and chooses delivery from a local store. That journey is one purchase for the merchant, one opportunity for a supplier to advertise, and another reason for the shopper to return. It helps explain why a modern retailer can grow its media business faster than the merchandise business that created the audience.
Walmart’s results, released November 19 for the third quarter of fiscal 2027, bring that model into focus. U.S. eCommerce sales grew 23% year over year, while its U.S. advertising business rose 37%. Walmart U.S. net sales increased just 3.6%. These figures measure different activities and cannot be added together, but their contrast reveals where Walmart’s commercial momentum is concentrated: digital discovery, shopping convenience and monetization around the transaction.
THE BIG STORY | WALMART Q3 & THE RETAIL MEDIA FLYWHEEL
The fastest-growing part of retail may not be the sale itself
Five numbers explain the shift
Walmart reported $188.8 billion in consolidated quarterly revenue, up 5.2% year over year. Global eCommerce grew 17%, led by store-fulfilled pickup and delivery. Global advertising grew 25%, while membership-fee revenue rose 17%. The more striking contrast is inside the U.S. business, where online sales, advertising and membership activity outpaced total segment sales growth.
| Walmart Q3 FY27 metric | YoY | How to read it |
|---|---|---|
| Walmart U.S. net sales | +3.6% | The underlying merchandise scale |
| Walmart U.S. eCommerce | +23% | Pickup, delivery and marketplace momentum |
| Walmart U.S. advertising | +37% | Broader ad business, including media assets |
| Walmart Connect, ex-VIZIO/Vibe | +36% | Core U.S. retail-media growth |
| Global eCommerce / advertising | +17% / +25% | Broader footprint; period mix matters |
Walmart figures are year-over-year growth rates, not comparable dollar contributions. Advertising is recognized either as net sales or a reduction to cost of sales, depending on the arrangement; the release does not establish an advertising margin or campaign-level ROAS.
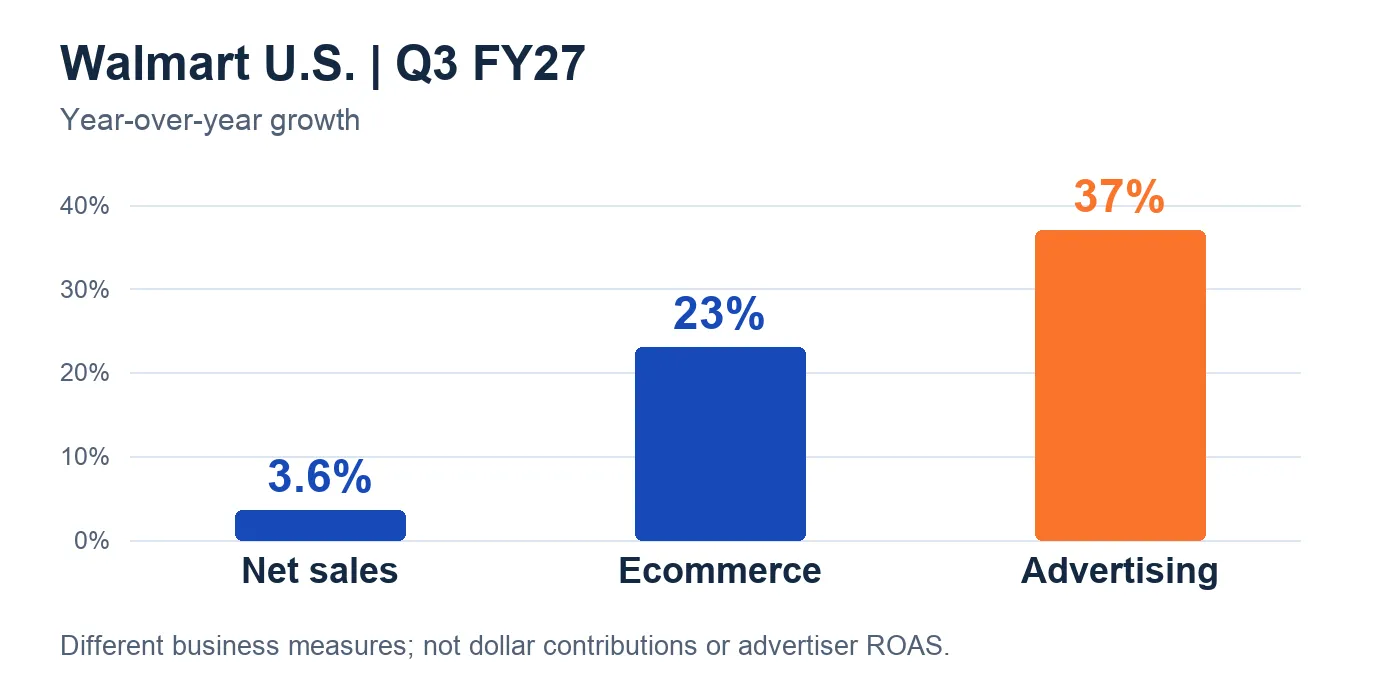
Image source: Beecommercer, based on Walmart’s Q3 FY27 release
Why stores still matter in a digital growth story
It would be easy to interpret the results as “online beats physical retail.” That misses the operating mechanism. Walmart says store-fulfilled pickup and delivery led global eCommerce growth. Local stores are not separate from the digital transaction; they are fulfillment capacity, inventory access and a fast last mile. Sam’s Club U.S. eCommerce grew 30%, also helped by club-fulfilled pickup and delivery. The store network can make a digital promise credible when a buyer needs an item now, not next week.
For advertising, that convenience increases the usefulness of the shopping environment. A merchant can place sponsored products close to a search, a cart and an available fulfillment option. A retailer can also connect online interactions with transactions that occur across its own channels. Those capabilities can be valuable to brands, but they do not guarantee that every sponsored sale is incremental: a customer might have bought the same product without the ad.

Image source: Walmart FY27 Q3 Earnings Release
The ad business is not simply a VIZIO story
Walmart’s broader U.S. advertising figure includes activity associated with VIZIO and Vibe. Crucially, Walmart also reported 36% growth for Walmart Connect excluding those businesses. That narrows the explanation: the headline is not merely the effect of added television or media inventory. The core retail-ad operation itself grew strongly. At the same time, the 37% increase describes Walmart’s advertising business, not a measured return earned by a typical supplier buying that inventory.
There is an important geographic warning as well. Walmart International eCommerce declined 2% and its advertising business fell 15% in the quarter. Walmart attributes much of that comparison to the timing of Flipkart’s Big Billion Days promotion, which moved relative to the prior-year quarter, and expects a corresponding Q4 benefit. This is why an annualized growth narrative built from one holiday-driven quarter can mislead. Compare market-by-market, and distinguish changes in the event calendar from durable shifts in consumer demand.

Image source: Walmart Connect
The brand question is no longer “Which platform has more traffic?”
A retailer with its own shopping audience competes for media budgets with Google, Meta, Amazon and the open web. But it is selling a different kind of proposition: visibility inside an environment where product research, fulfillment choice and purchase are already connected. That may make retail media attractive for lower-funnel activation, yet it also creates trade-offs for brands that want direct relationships and repeat purchases on their own stores.
If a brand increases marketplace advertising, reported attributed revenue may rise while contribution profit barely moves. The same branded shopper might click an ad instead of an organic listing. Discounts, referral or marketplace fees, fulfillment expense and advertising spend can stack on the same order. Conversely, some retail-media impressions may help shoppers discover a new product they would not otherwise consider. The job is to separate those effects rather than accepting last-click ROAS as the full answer.
A useful decision framework has three views. First, track shelf health: stock, price competitiveness, ratings, delivery reliability and organic product visibility. Second, track media efficiency: incremental sales where tests allow, contribution margin after platform costs, new-to-brand buyers and paid versus organic sales mix. Third, track customer ownership: repeat purchases, email or loyalty consent, and whether retail-platform growth is enlarging the entire business or moving customers from a more profitable channel.

Image source: Walmart Connect
Three uses of retail media require three scorecards
Some campaigns protect existing shelf share, some introduce products to new audiences, and others convert shoppers who already intend to buy. Those are valid but different jobs. A branded sponsored placement may be worthwhile as a defensive cost of distribution, yet it should not receive the same acquisition credit as a truly new buyer. A marketplace that supplies last-click attribution cannot automatically show whether another channel created the demand a week earlier. That is why a single reported ROAS target can encourage a brand to overfund the easiest-to-attribute sales.
The alternative is to classify campaigns by objective before judging them. For defensive media, monitor share of search, organic displacement and whether competitors gain when spend is reduced. For discovery, look for incremental category penetration and new-to-brand indicators where available. For conversion, reconcile ad-attributed sales with total SKU revenue, returns, discounts and contribution margin. None of these metrics is perfect; together they make it harder for reporting convenience to dictate budget strategy.
This also protects the independent store. A retailer-owned ad can create profitable distribution, while an owned site can capture consent, build repeat-purchase programs and support deeper product education. Rather than forcing every customer into one destination, define which products and buyer journeys deserve marketplace distribution, which deserve direct conversion, and what each must contribute to the business.
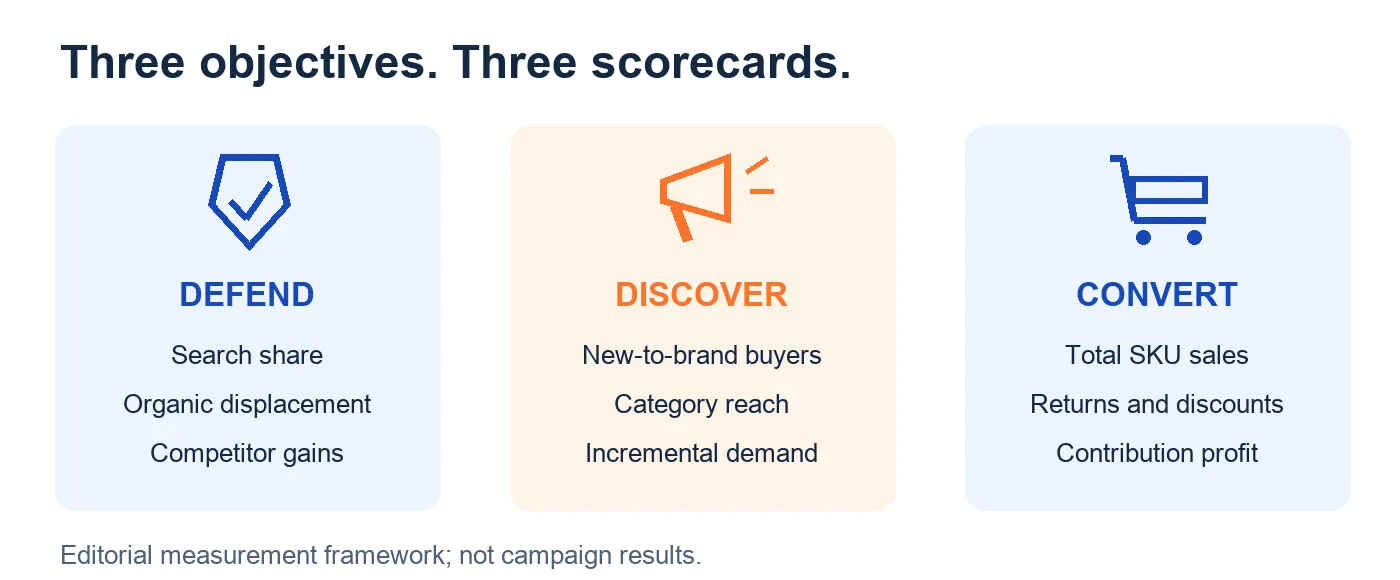
Image source: Beecommercer
A practical 30-day retail-media test
Week 1 — Establish a clean baseline. Group your top products by contribution margin and fulfillment reliability. Record Walmart/Amazon retail-media spend, attributed sales, organic sales, direct-site orders and inventory constraints where data is available. Flag products already dominating branded searches: they are poor candidates for judging new customer acquisition from platform ROAS alone.
Week 2 — Test one meaningful hypothesis. For an eligible product set, vary sponsored visibility in comparable markets, SKUs or time windows while keeping promotional conditions as stable as practical. If a formal holdout is unavailable, label the result directional rather than causal. Separately monitor total units and brand search, not only ad-attributed revenue.
Weeks 3–4 — Reconcile the economics. Compare profit after ad spend, channel fees and shipping; inspect whether paid orders displaced organic orders; and review repeat-purchase or new-customer indicators where permitted. Scale only when the combined channel result improves, not just when a platform dashboard reports a higher ROAS.
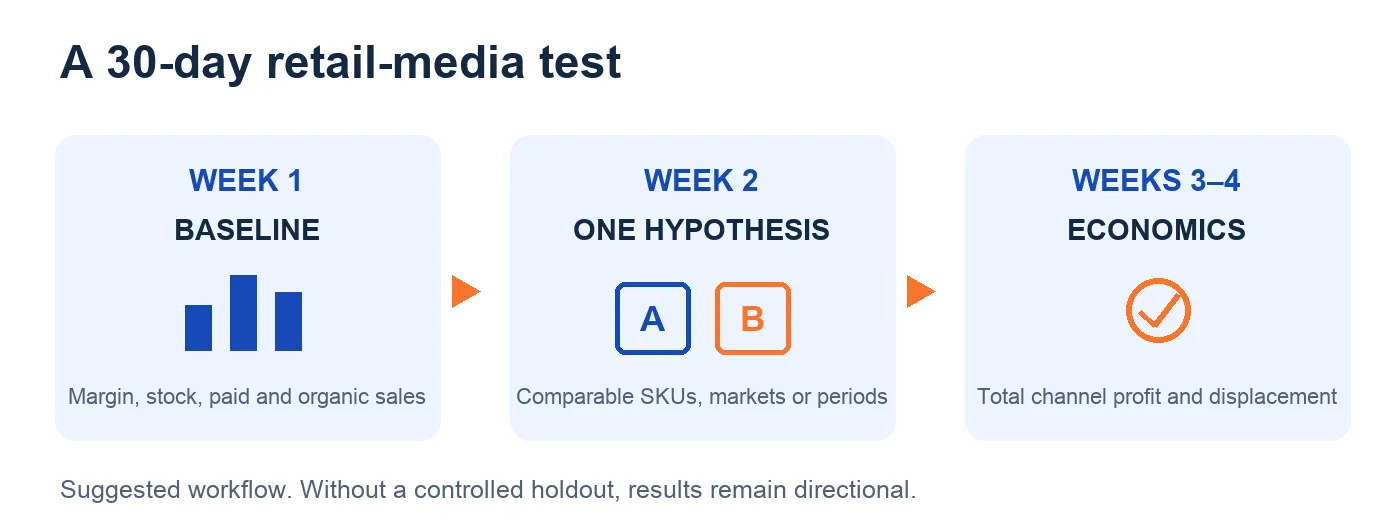
Image source: Beecommercer
TREND WATCH | WHAT ELSE MOVED
Black Friday shoppers are using AI to compare deals
DHL surveyed 29,000 online shoppers and 5,800 businesses across 29 countries. Among surveyed Black Friday shoppers, 88% had used or planned to use AI for price comparisons, while 47% had already used AI chat or assistants to browse or buy. These measures combine self-reported behavior and stated intention; they are not proof of future sales. For retailers, the near-term task is accurate price, stock, delivery and return data wherever product comparisons happen.
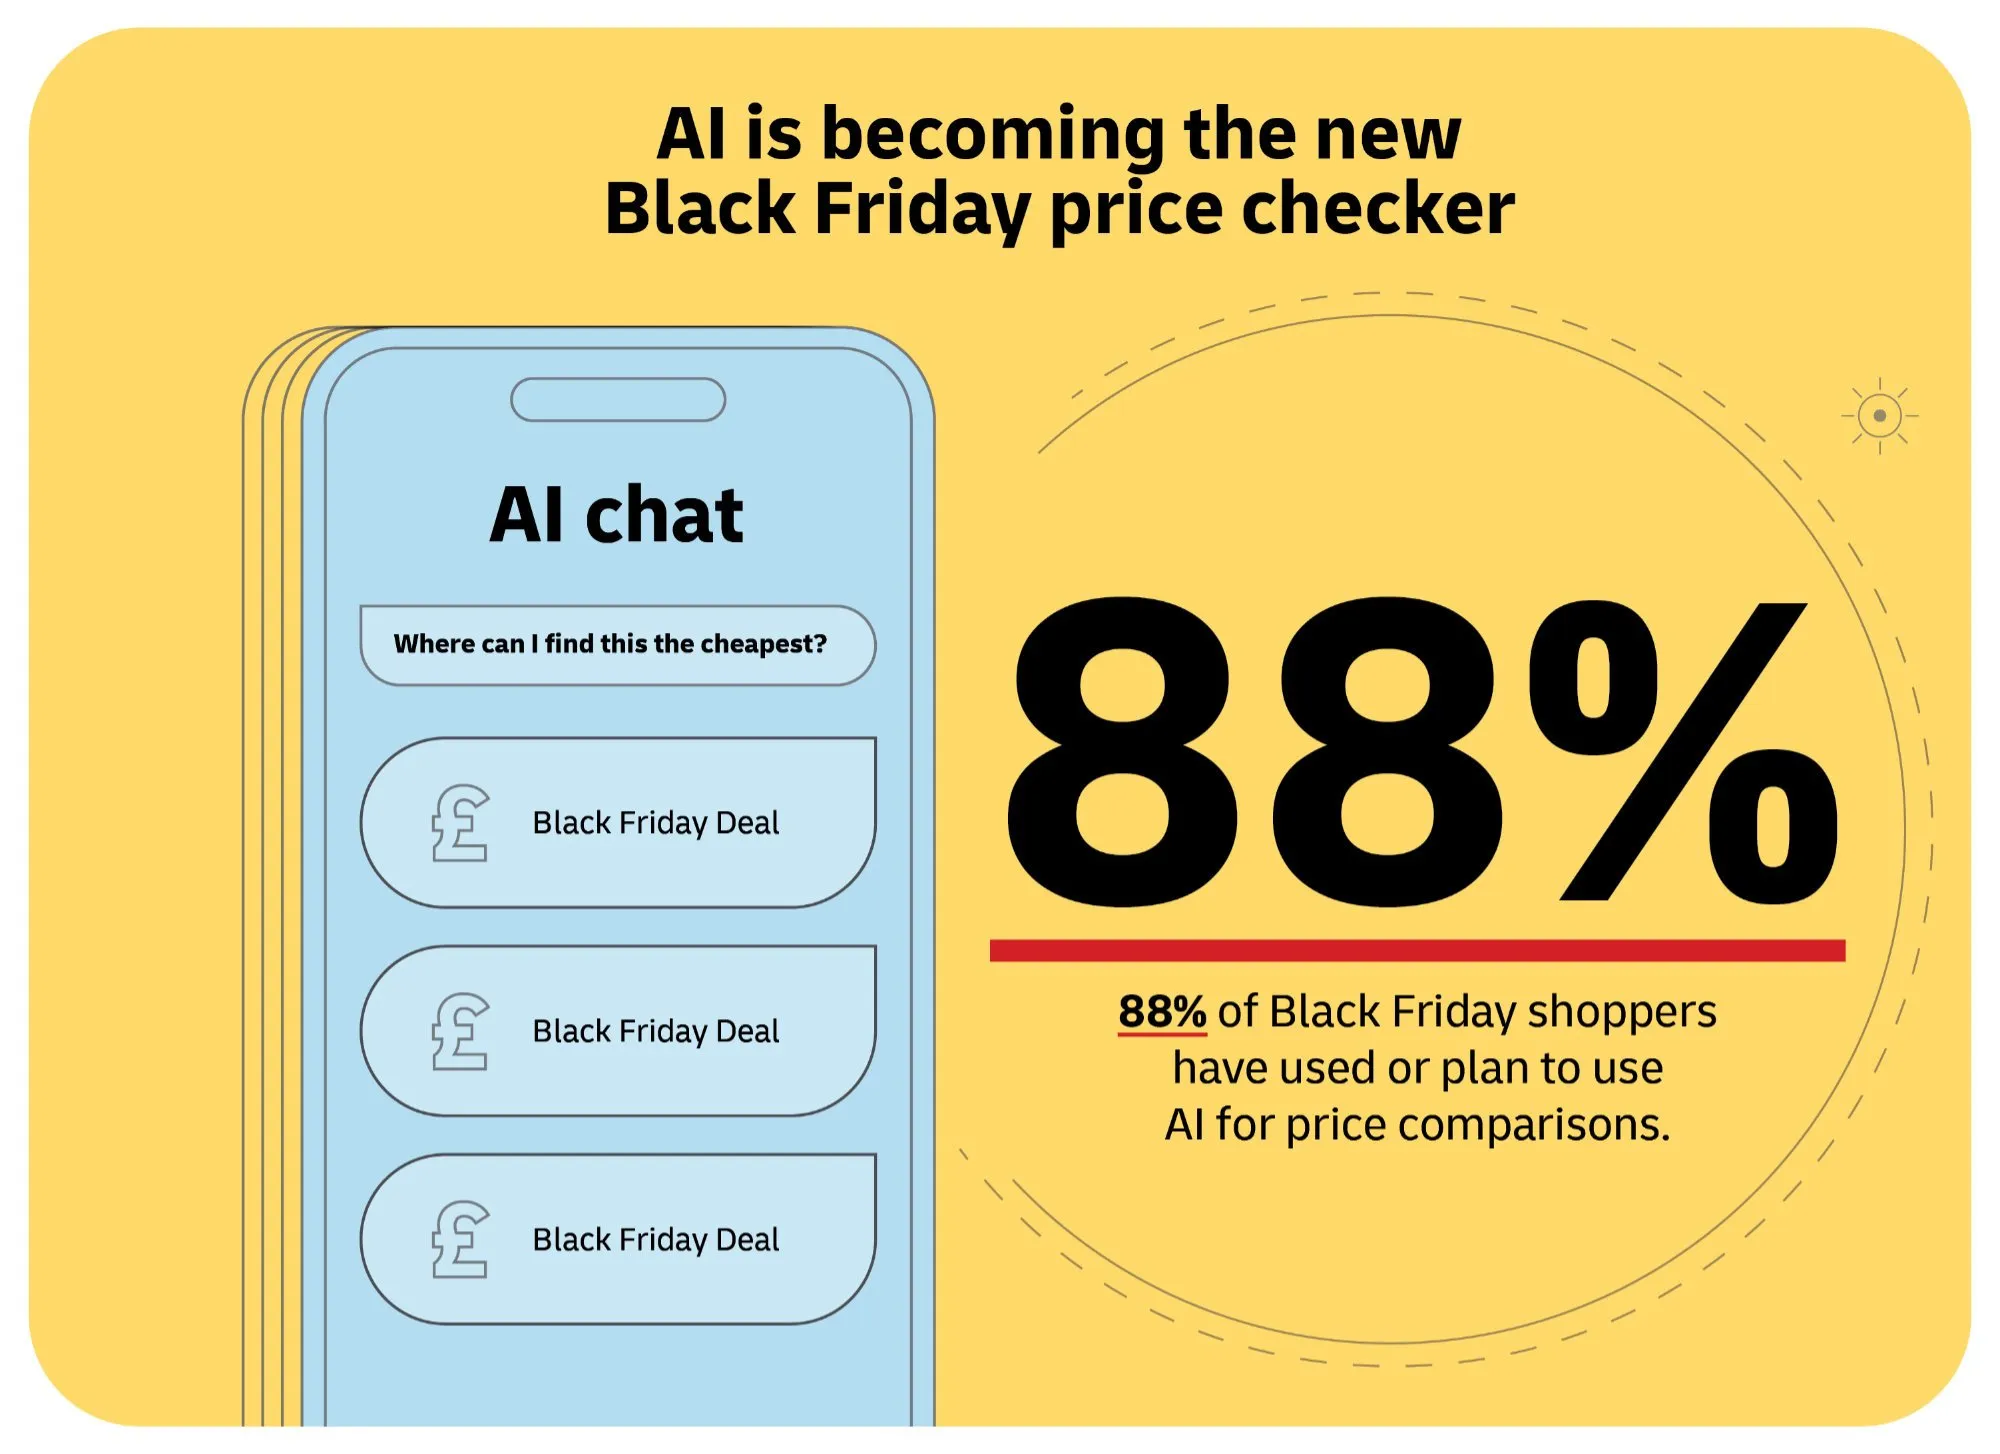
Image source: DHL Group
Search advertisers are questioning cost and placement visibility
Search Engine Land summarizes interviews reported by The New York Times with advertisers reducing Google Search spend amid higher perceived costs and changing AI search placement. These are individual cases, not evidence of an across-market budget exodus; Google says AI also creates more commercial search opportunities. For advertisers, rerun channel allocations against incremental profit and qualified demand rather than judging the change from CPC or impressions alone.

Image source: Google Ads
Mailchimp’s proposed sale changes the email-platform conversation
Intuit signed an agreement to sell Mailchimp to Bending Spoons for approximately $3.68 billion: about $3.31 billion in cash and $368 million in stock. Closing is expected in early 2027, subject to approvals. This is an ownership change, not a completed migration or an announced product shutdown. Merchants should preserve audience consent records, document automations and integration dependencies, and judge email by delivered revenue and retention—not open rate alone, which privacy protections can inflate.
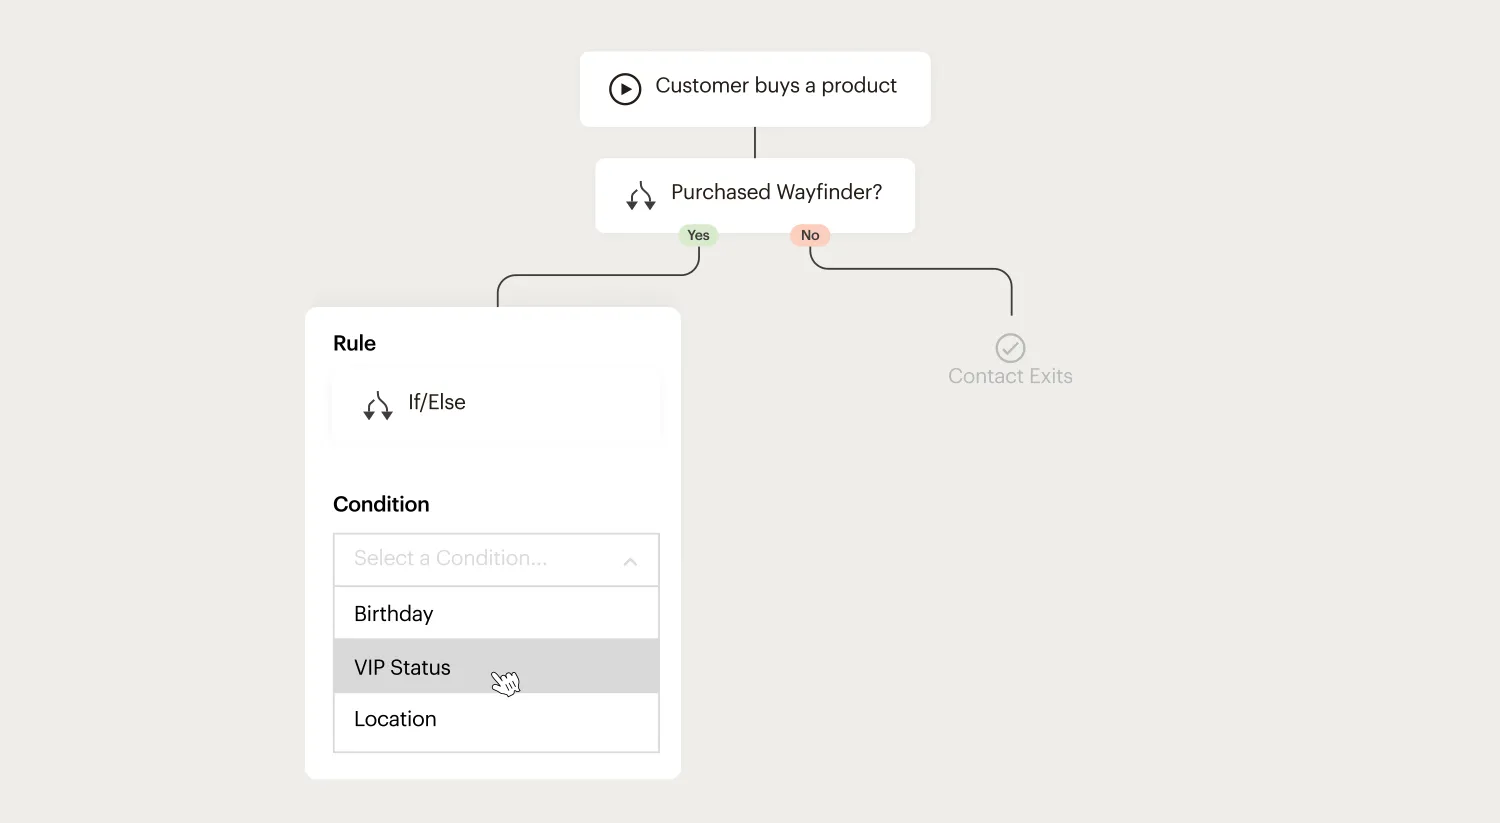
Image source: Mailchimp
A content-pruning case questions one-number AI visibility decisions
A Search Engine Land contributor describes one client site where AI-feature impressions fell 62% after removing blog posts, while organic clicks rose 14%. Other site changes and seasonality prevent a causal conclusion. The useful signal is methodological: do not delete content solely because an AI-visibility score looks weak, or preserve it solely because citations are high. Evaluate page purpose, qualified search visits and business outcomes before and after any change.
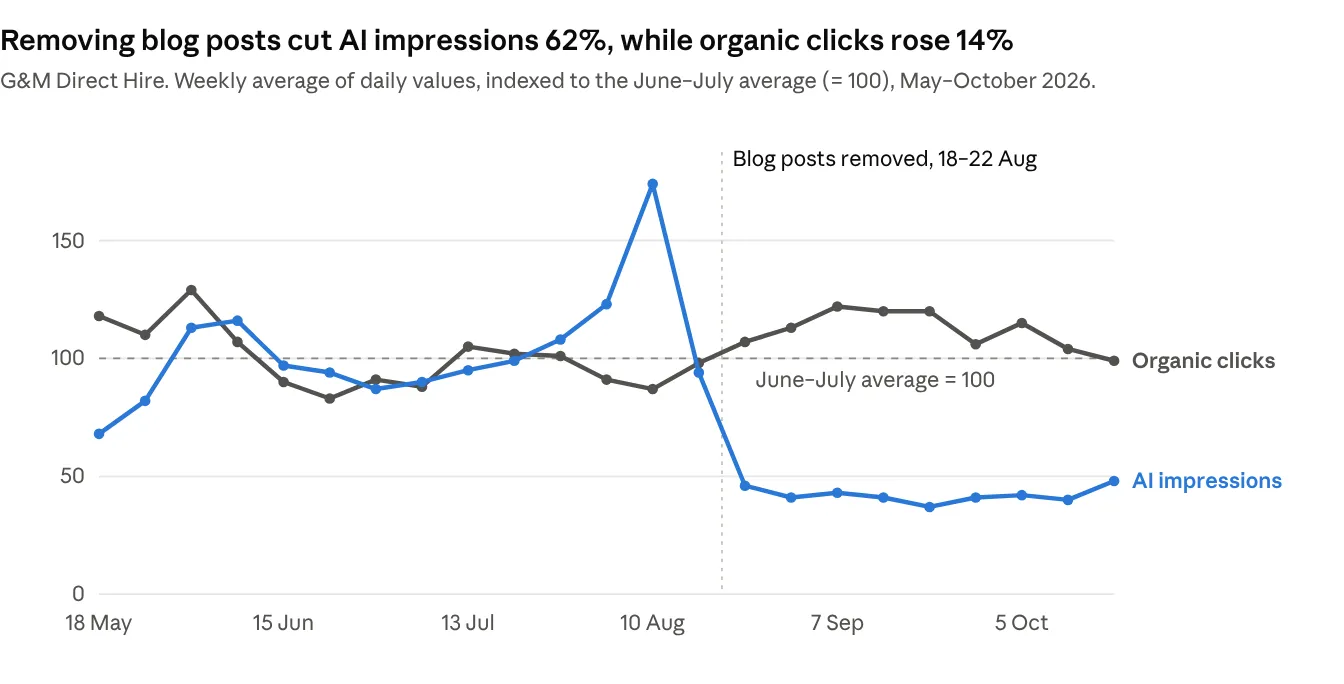
Image source: Luca Tagliaferro / Search Engine Land
THE OPERATOR’S CLOSE
Own the margin, not merely the media placement
Walmart’s results show how valuable a commerce audience becomes when browsing, fulfillment, membership and advertising reinforce one another. DHL’s holiday research suggests AI may add another comparison layer before the sale. Neither trend eliminates independent sites or traditional search. It raises the value of correct product data, a dependable purchase experience and measurement that follows total contribution profit across channels.
The Beecommercer Team